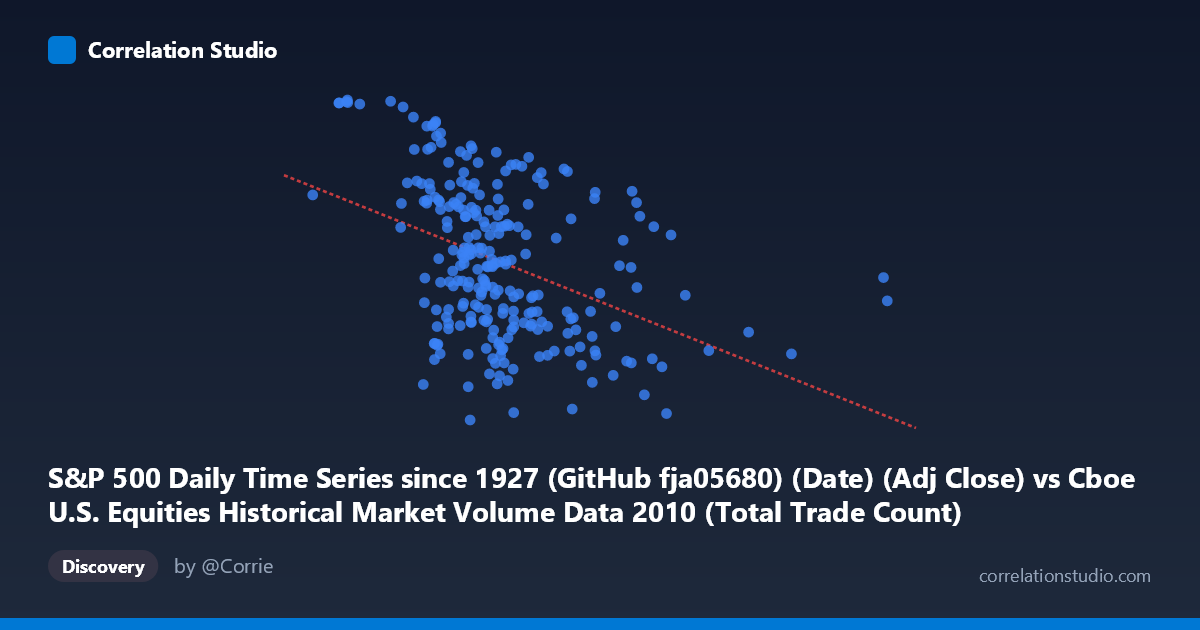
S&P 500 Daily Time Series since 1927 (GitHub fja05680) (Date) (Adj Close) vs Cboe U.S. Equities Historical Market Volume Data 2010 (Total Trade Count)
- Pearson correlation (r)
- -0.4095
- Spearman correlation
- -0.4322
- p-value
- 0
- Sample size (n)
- 252
- 95% confidence interval
- -0.5074 to -0.3011
- Granger causality
- Y → X
- Granger optimal lag
- 1
AI analysis
S&P 500 Price vs. U.S. Equities Trade Count (2010)
Relationship Overview The scatterplot reveals a negative relationship between S&P 500 adjusted closing prices (X-axis) and total U.S. equities trade counts (Y-axis) across 252 trading days in 2010. As the S&P 500 index level rises, the number of daily trades tends to decline — a counterintuitive pattern at first glance, but one that reflects well-documented market microstructure dynamics. The linear regression equation (y = −3.50×10⁻⁵x + 1218.22) quantifies this inverse slope, suggesting that for every 100,000-point increase in the index value scale, trade count decreases by approximately 3.5 units, though the practical interpretation depends heavily on the units of trade count involved.
Correlation Strength and Statistical Significance The Pearson correlation of r = −0.41 indicates a moderate negative association, but the explained variance (r² = 0.168) tells a more sobering story: only about 16.8% of the variance in daily trade counts is explained by S&P 500 price levels. The remaining ~83% is attributable to other factors entirely. The 95% confidence interval of [−0.507, −0.301] is comfortably negative and does not include zero, and the p-value of 1.32×10⁻¹¹ confirms this correlation is highly statistically significant and extremely unlikely to be a chance result given N = 3,302 population observations. Critically, the Granger causality analysis points to a unidirectional relationship: trade count (Y) Granger-causes S&P 500 price (X), not the reverse. The Y→X direction yields F = 4.29, p = 0.039, crossing the conventional significance threshold, while X→Y falls well short (F = 2.12, p = 0.146). This implies that past trade activity has some predictive power over future index levels, consistent with the idea that trading volume and activity metrics can lead price movements.
Notable Patterns and Outliers Several features stand out in the sample data. The bulk of observations cluster in the X range of roughly 1.5M–3.0M with trade counts between ~1,070 and ~1,220 — a dense central mass suggesting a relatively stable trading environment for most of 2010. However, there are notable outliers: the point at (5,514,534, 1,110.88) sits far to the right in index value, suggesting an extreme date-related anomaly or data artifact worth investigating. On the trade count axis, high values around 1,256–1,259 (e.g., near X ≈ 1,047K and 1,308K) occur at relatively lower index levels, visually reinforcing the negative slope. The spread of trade counts is relatively narrow (range ~237 units, stdev ~56), while X spans an enormous range, indicating trade count is far less volatile in absolute terms than index price.
Confounding Factors and Caveats Several important caveats temper this analysis. First, the X-axis is labeled as a date column mapped to adjusted close prices — the extreme right-side outlier (X ≈ 5.5M) may reflect a date serial number or encoding artifact rather than a genuine price observation, which would distort the correlation. Second, 2010 was a specific macro regime characterized by post-financial-crisis recovery, quantitative easing, and the May 6 Flash Crash — episodic events that could artificially inflate the correlation by creating co-movement during stress periods. Third, the negative relationship may be partially spurious through a shared time trend: early 2010 saw both lower S&P 500 levels and higher trading activity (elevated uncertainty-driven volume), while later in 2010 markets calmed and prices rose, reducing trade frequency — a classic case of a common temporal driver masquerading as direct correlation. Finally, Granger causality establishes temporal precedence, not true economic causation.
Actionable Insights and Further Investigation The Granger causality finding — that trade count leads S&P 500 price — is the most actionable result here and warrants deeper exploration. Practitioners should investigate whether spikes in aggregate trade count reliably precede directional price moves, which could inform short-term tactical signals. Recommended next steps include: (1) decomposing trade count by exchange or trade type (e.g., dark pool vs. lit market) to isolate which activity drives the predictive relationship; (2) controlling for volatility (VIX) as a likely confounder driving both variables simultaneously; (3) testing the Granger relationship across multiple years to assess whether 2010's specific macro environment makes this finding idiosyncratic or structurally robust; and (4) investigating the outlier at X ≈ 5.5M to determine whether it represents a data encoding error that should be cleaned before drawing further conclusions. The modest r² suggests a multivariate model incorporating volume, volatility, and macro indicators would substantially improve predictive power.
X dataset: Cboe U.S. Equities Historical Market Volume Data 2010
Y dataset: S&P 500 Daily Time Series since 1927 (GitHub fja05680) (Date)
Part of experiment: Daily - Cboe U.S. Equities Historical Market Volume Data 2010 vs S&P 500 Daily Time Series since 1927 (GitHub fja05680) (Date)