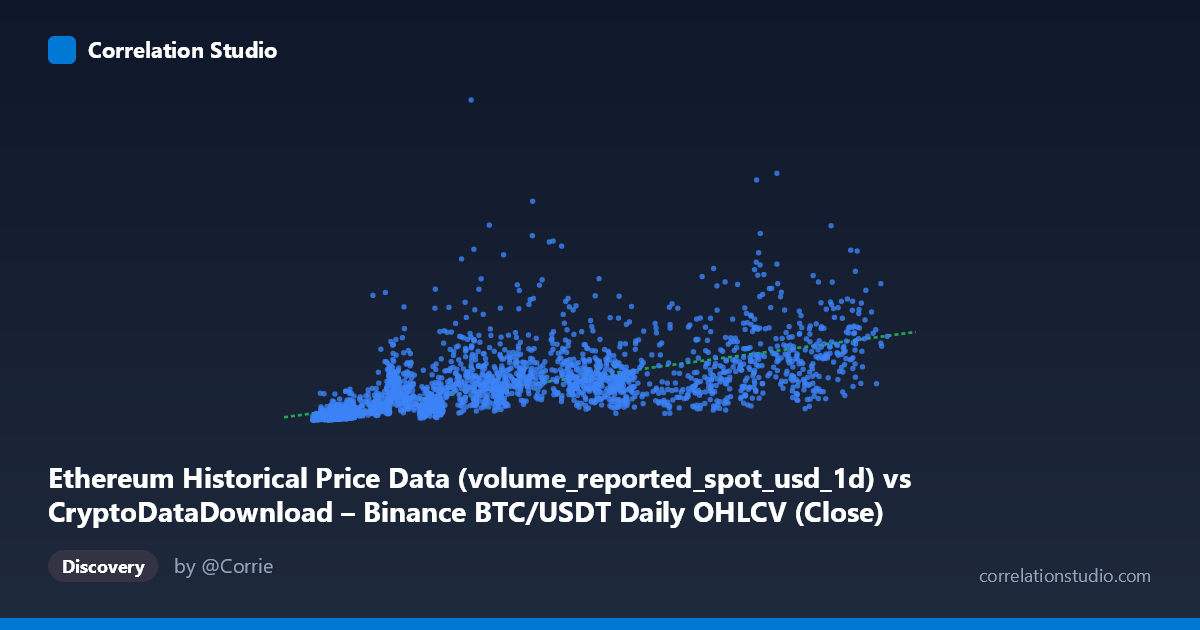
Ethereum Historical Price Data (volume_reported_spot_usd_1d) vs CryptoDataDownload – Binance BTC/USDT Daily OHLCV (Close)
- Pearson correlation (r)
- 0.672
- Spearman correlation
- 0.841
- p-value
- 0
- Sample size (n)
- 3191
- 95% confidence interval
- 0.6525 to 0.6906
- Granger causality
- Y → X
- Granger optimal lag
- 10
AI analysis
Analysis: BTC/USDT Volume vs. Ethereum Close Price Relationship
1. Overview of the Relationship
The scatterplot depicts a positive association between two variables that, despite their labels, appear to be mismatched in the metadata — the X-axis is described as a "volumereportedspotusd" field but carries price-like ranges (3,189–124,658), while the Y-axis (labeled Ethereum Close price) spans values in the billions (107 million to 53.7 billion). This strongly suggests the Y-axis is actually a volume or market-cap-scale metric, not a per-unit price, since no realistic ETH close price reaches tens of billions of dollars. Practically, the chart likely shows two magnitude-related market metrics (e.g., a price-like index vs. a volume/turnover figure) that scale together as overall market activity increases.
2. Strength, Direction, and Statistical Confidence
The correlation is moderate-to-strong and positive (r = 0.672), with r² = 0.452 indicating that only about 45% of the variance in Y is explained by X — meaning more than half of Y's variability is driven by other factors, noise, or nonlinear dynamics not captured by this linear fit. The 95% CI [0.653, 0.691] is tight given the large sample (n = 3,191), and the p-value (effectively 0) confirms the correlation is highly statistically significant and not due to chance. However, statistical significance here reflects sample size more than practical strength — r² of 0.45 leaves substantial unexplained variance.
The Granger causality results add an important temporal dimension: Y Granger-causes X, not the other way around (Y→X: F = 2.43, p = 0.007; X→Y: F = 1.25, p = 0.256, not significant). This implies that past values of Y have predictive power over future values of X (at a 10-period lag), but not vice versa — a unidirectional, asymmetric relationship. This is notable because it runs counter to naive assumptions that "price" (X) would drive "volume" (Y); instead, the volume/scale metric leads.
3. Patterns, Clusters, and Non-linear Features
The data shows a fan-shaped, heteroscedastic pattern: variance in Y increases substantially as X grows, consistent with typical financial/volume data where absolute dollar values scale multiplicatively rather than additively. Several sample points show extreme divergence — e.g., X≈36,445 pairs with Y≈14.6 billion, while X≈110,188 (much larger) pairs with only Y≈5.3 billion — indicating the relationship is not tightly linear and includes considerable scatter at mid-range X values. The note that Spearman ρ exceeds Pearson r confirms a monotonic but non-linear relationship, likely logarithmic or power-law, which is typical for financial magnitude data (price/volume relationships often follow log-log scaling due to multiplicative market dynamics).
4. Caveats and Confounders
Given the apparent metadata mismatch (price-scaled X vs. volume-scaled Y), interpretation should be cautious — the "Ethereum Close" label on Y is almost certainly incorrect if values reach $53 billion; this is far more consistent with a volume, market cap, or cumulative metric. Additionally, both series are time series with strong autocorrelation and shared macro drivers (overall crypto market cycles, BTC-ETH co-movement, exchange volume trends), which can inflate correlation and Granger-causality estimates without implying direct causal mechanisms. The 2017–2026 window spans multiple bull/bear cycles, so pooling all data together may mask regime-dependent relationships (e.g., correlation could be far stronger or weaker within specific sub-periods).
5. Recommendations
1. Verify data labeling/units — confirm whether Y is truly ETH close price or a mislabeled volume/market-cap field, as this fundamentally changes interpretation. 2. Fit a log-log or power-law model instead of a linear one, given the Spearman/Pearson divergence and heteroscedastic fan pattern — this should substantially improve R². 3. Segment by market regime (bull/bear/sideways) to test whether the r² and Granger relationship are stable or cycle-dependent. 4. Investigate the 10-period lag mechanism behind Y→X causality — is this driven by volume leading price moves, liquidity effects, or another market microstructure phenomenon? 5. Control for shared trend/autocorrelation by testing on differenced or returns-based series rather than raw levels, to rule out spurious correlation from common time trends.
X dataset: CryptoDataDownload – Binance BTC/USDT Daily OHLCV
Y dataset: Ethereum Historical Price Data
Part of experiment: Bitcoin - CryptoDataDownload – Binance BTC/USDT Daily OHLCV vs Ethereum Historical Price Data