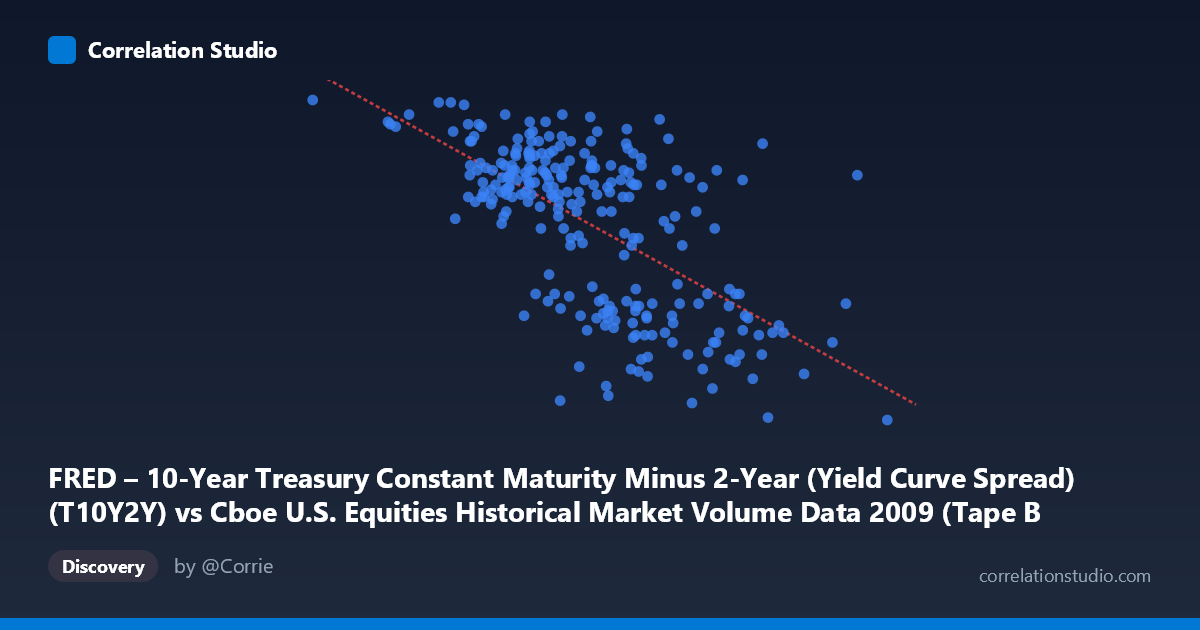
FRED – 10-Year Treasury Constant Maturity Minus 2-Year (Yield Curve Spread) (T10Y2Y) vs Cboe U.S. Equities Historical Market Volume Data 2009 (Tape B Notional)
- Pearson correlation (r)
- -0.6309
- Spearman correlation
- -0.5969
- p-value
- 0
- Sample size (n)
- 250
- 95% confidence interval
- -0.7002 to -0.5499
- Granger causality
- None
- Granger optimal lag
- 1
AI analysis
Analysis: Yield Curve Spread vs. Tape B Notional Trading Volume (2009)
Relationship Overview
The scatterplot reveals a moderate negative relationship between the 10-Year minus 2-Year Treasury yield curve spread and Tape B notional trading volume throughout 2009. As the yield curve steepened (higher spread values, approaching the right side of the x-axis ranging from ~$1.3B to ~$9.5B in notional volume), the yield curve spread tended to compress toward lower values. This inverse pattern is visually apparent as a downward-sloping cloud of points, consistent with the linear regression equation y = -1.60077E-10x + 3.15171. The relationship makes intuitive economic sense in the context of 2009: as equity market activity surged during the post-crisis recovery (higher notional volumes), the yield curve was simultaneously steepening dramatically as the Fed held short rates near zero — but the direction here suggests that higher trading volumes correspond to tighter spreads, pointing to the more volatile, uncertainty-driven early 2009 period when volumes were elevated and the curve had not yet fully steepened.
Correlation Strength and Statistical Significance
The correlation coefficient of r = -0.6309 indicates a moderate-to-strong negative linear association, though not a deterministic one. The r² = 0.3981 is the more grounding statistic: approximately 39.8% of the variance in the yield curve spread is explained by Tape B notional volume, leaving roughly 60% attributable to other forces. The 95% confidence interval for r of [-0.7002, -0.5499] is meaningfully narrow and entirely negative, confirming the direction of the relationship with high confidence. The p-value of effectively zero (given N = 3,232 and n = 250) confirms this is not a chance finding in the sample, though that very large population size means even small correlations would achieve significance — the r² keeps the result grounded. Critically, Granger causality tests find no significant predictive direction in either direction (X→Y: F = 0.5315, p = 0.467; Y→X: F = 0.3834, p = 0.536), meaning that knowing today's trading volume does not help predict tomorrow's yield curve spread, and vice versa. This strongly cautions against any causal narrative: the correlation likely reflects a shared common driver rather than one variable influencing the other.
Patterns, Clusters, and Outliers
Several structural features stand out in the point cloud. There is a notable cluster of high-volume, lower-spread observations on the right side of the chart (x ~$7B notional), where yield spreads compress into the 1.57–1.97 range — consistent with late 2009 when markets had stabilized and volumes remained elevated but the curve was steepening. Conversely, a cluster of lower-volume, higher-spread points appears on the left (x < ~$4B), where spreads reach as high as 2.72–2.82. The point at approximately (1.32B notional, 2.82 spread) stands out as a potential outlier at the extreme low-volume end, representing one of the quietest trading days of the year coinciding with the highest spread recorded. The scatter is notably wide through the middle range ($4B–$6B), suggesting considerable heteroscedasticity and that the linear model fits poorly in the central region. A subtle non-linear (possibly quadratic or threshold) pattern may be present, with the relationship appearing steeper at the volume extremes.
Confounding Factors and Caveats
Several important caveats apply. First, 2009 was an extraordinary year — spanning the post-Lehman crisis trough (March 2009) through the early recovery — meaning both variables were undergoing structural regime shifts simultaneously, driven by Fed policy, risk appetite, and market-wide deleveraging. The correlation may largely reflect this shared temporal trend rather than any meaningful structural link between equity trading volume and Treasury spreads. Second, Tape B specifically covers NYSE American (AMEX) and regional exchange listings, a subset of total market volume, which may introduce selection bias relative to using total market notional. Third, the mismatch in dataset descriptions (X-axis label corresponds to volume while Y-axis corresponds to the yield spread, and vice versa in the dataset notes) warrants careful verification of variable assignment before drawing conclusions. Finally, seasonality, day-of-week effects, and macroeconomic announcement days (FOMC, NFP) could independently drive both variables, acting as unmeasured confounders.
Actionable Insights and Further Investigation
Given the absence of Granger causality, practitioners should not use yield curve spreads as a short-term predictor of next-day equity trading volumes, nor vice versa. However, the meaningful r² of ~40% suggests the variables share common macroeconomic drivers worth identifying. Recommended next steps include: (1) decomposing both time series to remove shared trends (e.g., the VIX or Fed policy timeline) and re-testing the partial correlation; (2) testing for a non-linear or threshold model, given the visual heteroscedasticity — perhaps a spline regression or piecewise linear model would outperform the linear fit; (3) extending the analysis across multiple years (the yield curve spread dataset extends back to 1976) to test whether the 2009 relationship is a crisis-period anomaly or a persistent structural feature; and (4) incorporating VIX, total market volume, and Fed Funds rate as control variables to isolate whether any direct link between these two series survives multivariate adjustment.
X dataset: Cboe U.S. Equities Historical Market Volume Data 2009
Y dataset: FRED – 10-Year Treasury Constant Maturity Minus 2-Year (Yield Curve Spread)
Part of experiment: Daily - Cboe U.S. Equities Historical Market Volume Data 2009 vs FRED – 10-Year Treasury Constant Maturity Minus 2-Year (Yield Curve Spread)