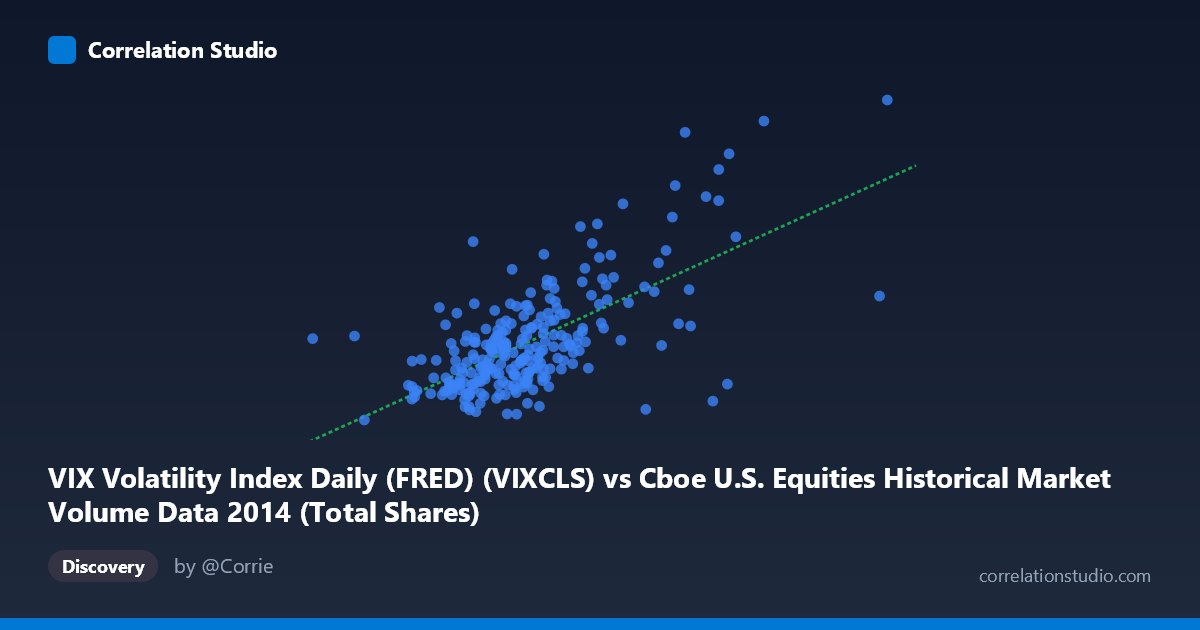
VIX Volatility Index Daily (FRED) (VIXCLS) vs Cboe U.S. Equities Historical Market Volume Data 2014 (Total Shares)
- Pearson correlation (r)
- 0.6593
- Spearman correlation
- 0.5718
- p-value
- 0
- Sample size (n)
- 252
- 95% confidence interval
- 0.5832 to 0.7239
- Granger causality
- None
- Granger optimal lag
- 1
AI analysis
Analysis: VIX Volatility Index vs. U.S. Equity Market Volume (2014)
Relationship Overview The scatterplot reveals a moderate positive relationship between U.S. equity market trading volume (Total Shares, X-axis) and the VIX Volatility Index (Y-axis) across 252 trading days in 2014. As market volume increases, VIX tends to rise — a broadly intuitive finding, since periods of heightened fear or uncertainty typically drive both increased trading activity and elevated implied volatility. The linear regression equation (y = 1.979×10⁻⁸x + 5.485) suggests that each additional ~50 million shares traded is associated with roughly one point of VIX increase, though this relationship is clearly not uniform across the range.
Correlation Strength and Statistical Significance The Pearson correlation of r = 0.659 indicates a moderate-to-strong positive association, and critically, r² = 0.435 means that only about 43.5% of the variance in VIX is explained by trading volume — leaving more than half of VIX's day-to-day movement unexplained by volume alone. The 95% confidence interval of [0.583, 0.724] is relatively tight and excludes zero entirely, and the p-value of effectively 0 confirms the relationship is highly statistically significant given n=252 paired observations. However, the Granger causality results are notably absent of significance in both directions (X→Y: F=1.27, p=0.26; Y→X: F=0.46, p=0.50), meaning neither variable reliably predicts the other at a one-period lag. This is a crucial caveat: the correlation reflects co-movement, not a temporal predictive relationship, which substantially limits any forecasting application.
Patterns, Clusters, and Outliers The scatterplot exhibits a few visually distinct features. The bulk of observations cluster in a relatively compact zone — roughly 350–530 million shares and VIX values between 11 and 17 — suggesting that on most "normal" 2014 trading days, volume and volatility varied within a constrained range. However, there are clear high-leverage outliers in the upper-right region, most notably points near (710M shares, 25.2 VIX) and (670M shares, 23.6 VIX), which correspond almost certainly to the October 2014 market volatility spike driven by Ebola fears and global growth concerns. These outliers exert considerable influence on the regression line and likely inflate the correlation coefficient. There also appears to be a point around (575M shares, 10.9 VIX) — high volume but low VIX — which is anomalous and may represent a high-volume, low-fear period such as an options expiration day or index rebalancing event.
Confounding Factors and Caveats Several confounds complicate a clean causal interpretation. Seasonality is a strong candidate: year-end periods (November–December) tend to bring lower liquidity and altered volatility dynamics simultaneously, while periods like options expiration ("triple witching") mechanically inflate volume independent of fear. Macroeconomic events — Federal Reserve communications, geopolitical shocks — can simultaneously move both VIX and volume, creating spurious correlation. The dataset spans only one calendar year (2014), which means the results are heavily influenced by the October volatility event; the correlation may not generalize to other market regimes (e.g., 2017's persistently low-VIX environment). Furthermore, the X and Y axis labels appear swapped in the metadata (VIX is labeled as the X-axis source dataset but described under Y-axis notes), which warrants verification of data alignment before drawing firm conclusions.
Actionable Insights and Further Investigation Practitioners should avoid using trading volume as a standalone VIX predictor given the failed Granger causality tests — the relationship is contemporaneous, not predictive. To deepen this analysis, several steps are advisable: (1) Remove or flag the October 2014 outlier cluster and re-run the regression to assess their influence on r²; (2) Segment the data by market regime (low/medium/high VIX environments) to test whether the volume-volatility relationship is regime-dependent and non-linear; (3) Extend the time series beyond 2014 to test generalizability across bull and bear markets; (4) Introduce control variables such as S&P 500 returns, options expiration dates, and Fed announcement days to partial out confounders; and (5) Explore lagged correlations beyond one period, as the Granger test only examined a single lag, potentially missing longer-horizon predictive dynamics.
X dataset: Cboe U.S. Equities Historical Market Volume Data 2014
Y dataset: VIX Volatility Index Daily (FRED)
Part of experiment: Daily - Cboe U.S. Equities Historical Market Volume Data 2014 vs VIX Volatility Index Daily (FRED)