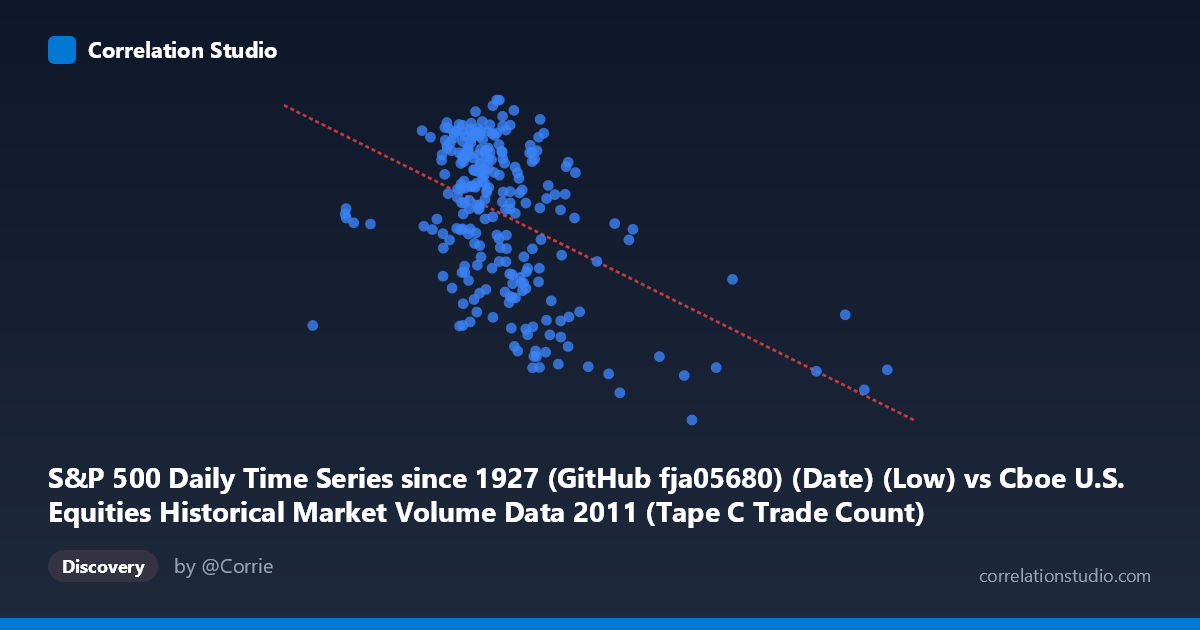
S&P 500 Daily Time Series since 1927 (GitHub fja05680) (Date) (Low) vs Cboe U.S. Equities Historical Market Volume Data 2011 (Tape C Trade Count)
- Pearson correlation (r)
- -0.4658
- Spearman correlation
- -0.3913
- p-value
- 0
- Sample size (n)
- 252
- 95% confidence interval
- -0.5573 to -0.3631
- Granger causality
- None
- Granger optimal lag
- 1
AI analysis
Analysis: S&P 500 Daily Low vs. Cboe Tape C Trade Count (2011)
Relationship Overview The scatterplot reveals a moderate negative relationship between the S&P 500 daily low price and the Cboe Tape C trade count across 2011. As the index's daily low value increases, the number of trades on Tape C (NYSE Arca and related venues) tends to decrease. This is an intuitively interesting finding: higher index price levels in 2011 were associated with fewer individual trades, suggesting that periods of market stress or lower prices coincided with elevated trading activity — consistent with the well-documented tendency for volume and trade fragmentation to spike during volatility and drawdowns.
Correlation Strength and Statistical Significance The Pearson correlation of r = -0.4658 indicates a moderate negative association, but the explained variance tells a more sobering story: R² = 0.2169 means only 21.7% of the variance in Tape C trade count is accounted for by the S&P 500 daily low. The remaining ~78% is driven by other factors entirely. The 95% confidence interval of [-0.5573, -0.3631] is entirely negative and reasonably tight, reinforcing that the direction of the relationship is reliable. The p-value of 5.55 × 10⁻¹⁵ confirms this correlation is highly unlikely to be a chance artifact given the sample of 252 paired observations drawn from a population of 3,780. Despite this statistical confidence, the Granger causality tests yield no significant predictive direction in either direction (X→Y: F = 0.044, p = 0.833; Y→X: F = 0.016, p = 0.899). This is a critical nuance: while the two series are correlated contemporaneously, neither reliably predicts the other at a one-period lag. The relationship reflects co-movement, not sequential causation.
Patterns, Clusters, and Outliers Several notable structural features are visible in the data. The bulk of observations cluster in the X range of roughly 450,000–650,000 (index low) with trade counts between approximately 1,250 and 1,350, forming a moderately dense core. However, a distinct lower-right tail is visible: points with high X values (e.g., ~775,000; ~921,000; ~1,220,000) are associated with notably lower trade counts, pulling the regression line downward. The point near (921,203, 1121) appears as a potential outlier — an unusually high index low paired with a very low trade count — and may warrant individual inspection. Conversely, the lower-left region shows several observations with relatively low index values and higher trade counts, consistent with the August 2011 market downturn when both volatility and trade fragmentation surged.
Confounding Factors and Caveats Several important caveats apply. First, 2011 was a highly unusual year — the U.S. debt ceiling crisis and European sovereign debt fears caused a sharp market correction in August, which likely drives much of the observed pattern as a structural regime shift rather than a stable long-run relationship. Second, Tape C trade count reflects only one reporting venue category, and routing decisions are influenced by exchange fee structures, maker-taker rebate changes, and broker internalization strategies that are entirely independent of index price levels. Third, the low price of the S&P 500 index is not a volume-neutral metric — on high-volatility days the daily low may be unusually depressed, creating a mechanical link with elevated trade counts that reflects shared exposure to volatility rather than a direct price-volume mechanism. The absence of Granger causality confirms these variables are likely jointly driven by an underlying latent factor (market stress/volatility) rather than causally linked.
Actionable Insights and Further Investigation Practitioners should not interpret this correlation as a trading signal — the Granger results confirm it lacks predictive value at even a one-day lag. A more productive investigation would introduce realized volatility (e.g., VIX levels) as a mediating variable to test whether the negative correlation is fully explained by shared volatility exposure, using partial correlation or a multivariate regression framework. It would also be valuable to expand the time window beyond 2011 to determine whether this relationship persists across different market regimes or is an artifact of a single stress year. Finally, decomposing Tape C trade count by trade size could reveal whether the elevated counts during low-price periods reflect retail or algorithmic fragmentation — a distinction with meaningful implications for market microstructure analysis.
X dataset: Cboe U.S. Equities Historical Market Volume Data 2011
Y dataset: S&P 500 Daily Time Series since 1927 (GitHub fja05680) (Date)
Part of experiment: Daily - Cboe U.S. Equities Historical Market Volume Data 2011 vs S&P 500 Daily Time Series since 1927 (GitHub fja05680) (Date)