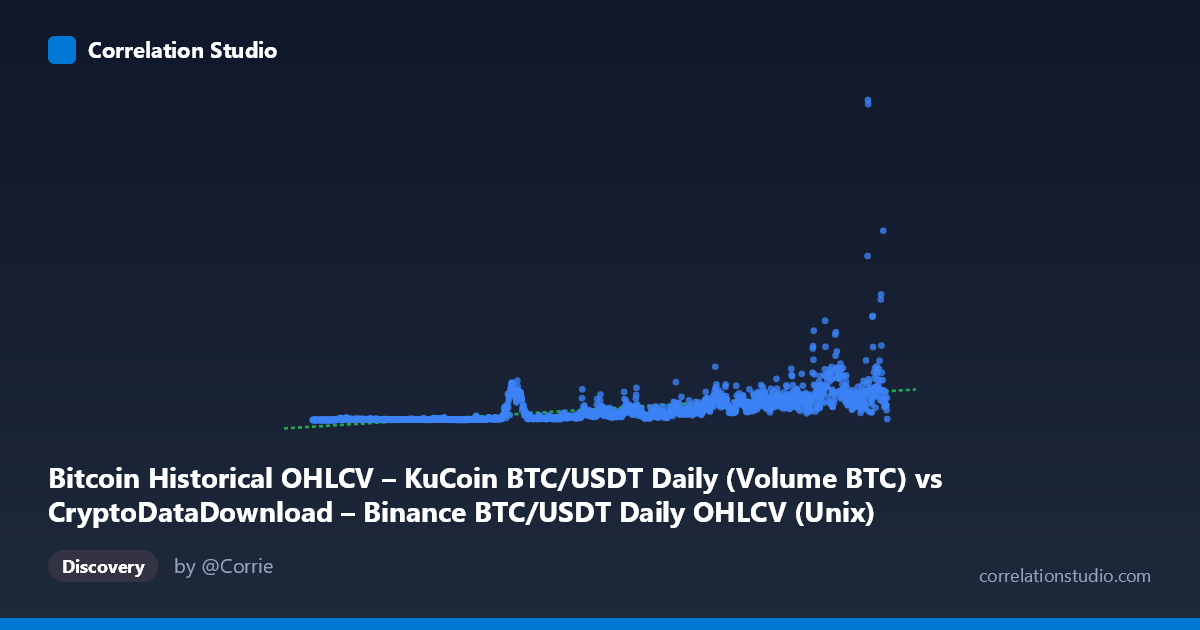
Bitcoin Historical OHLCV – KuCoin BTC/USDT Daily (Volume BTC) vs CryptoDataDownload – Binance BTC/USDT Daily OHLCV (Unix)
- Pearson correlation (r)
- 0.5758
- Spearman correlation
- 0.8748
- p-value
- 0
- Sample size (n)
- 1861
- 95% confidence interval
- 0.5446 to 0.6054
- Granger causality
- None
- Granger optimal lag
- 10
AI analysis
Analysis: Time (X) vs. Volume (Y) Relationship
1. Overview of the Relationship
This scatterplot is somewhat unusual in that the X-axis is a Unix timestamp rather than a conventional independent variable — effectively, it plots trading volume against the passage of time from late 2017 to late 2022. The visualization reveals a broad upward drift in Y values as X increases, consistent with Bitcoin's growing market maturity, liquidity, and trading activity over this five-year window. However, the relationship is far from a clean linear trend — it more closely resembles a noisy, heteroskedastic climb with periodic surges.
2. Strength, Direction, and Statistical Confidence
The Pearson correlation of r = 0.576 indicates a moderate positive relationship, but r² = 0.332 tells the more important story: only about 33% of the variance in trading volume is explained by time alone. The remaining ~67% is driven by other factors (market cycles, volatility events, exchange dynamics, etc.). The 95% CI [0.545, 0.605] is reasonably tight given the large sample (n=1,861), and the p-value of ~0 confirms the correlation is statistically robust — but statistical significance here reflects the large sample size more than practical predictive power. Critically, the Granger causality tests show no significant predictive direction (X→Y: p=0.44; Y→X: p=0.73). Since X is literally time, this result is somewhat definitional — time doesn't "Granger-cause" anything in a meaningful sense — but it underscores that the relationship is better understood as a long-term trend/drift rather than a dynamic causal system with lead-lag structure.
3. Notable Patterns and Outliers
Several features stand out in the sample data: - Exponential-like clustering: Early values (2017-2019) sit near-zero (single digits to low hundreds), while 2021-2022 values regularly exceed 5,000–40,000+, suggesting geometric rather than linear growth. - Volatility clusters: Sharp spikes (e.g., 40,616 and 13,767 in 2022) appear alongside more modest neighboring values, indicating episodic volume surges tied to specific market events (bull runs, crashes, exchange listings) rather than smooth growth. - Heteroskedasticity: Variance clearly increases with X — early years show tight, low-magnitude clustering, while later years show much wider dispersion, violating a core assumption of linear regression. - The note that Spearman ρ exceeds Pearson r strongly suggests a monotonic but non-linear (likely logarithmic or power-law) relationship, consistent with typical crypto market growth curves.
4. Confounders and Caveats
Because X is time itself, this "correlation" is really a trend analysis, and several caveats apply: - Non-stationarity: Both crypto prices and volumes are known to be non-stationary series with structural breaks (halvings, regulatory news, macro shocks like COVID-19 or the 2022 crypto winter). A single linear model cannot capture these regime shifts. - Autocorrelation: Daily volume data is highly autocorrelated; consecutive observations aren't independent, which can inflate apparent significance in naive correlation tests. - Exchange-specific bias: The metadata reveals a data provenance mismatch — X is labeled as KuCoin volume while Y is labeled as Binance OHLCV (or vice versa in the descriptions), meaning this may be comparing volume figures across two different exchanges rather than time vs. volume on one platform. This should be clarified before drawing conclusions. - Survivorship/growth bias: Overall crypto market cap and participation grew massively over this period, which could confound any single-asset volume trend with broader market adoption.
5. Recommendations for Further Investigation
Given the strong hint toward non-linearity, I'd recommend re-fitting the model using a log-transformation of Y (or both axes) to test for exponential/power-law growth, which would likely substantially improve R² over the linear fit. Additionally, decomposing the series into trend + seasonal + cyclical components (e.g., via STL decomposition) would help separate genuine long-term growth from short-term volatility clusters like the 2021 bull run and 2022 correction. Finally, clarifying the data provenance (Binance vs. KuCoin volume) is essential — if this is truly a cross-exchange volume comparison, a same-day scatter (not time-indexed) would be more informative, and analyzing the ratio of volumes between exchanges over time might reveal more actionable market-structure insights than the current time-trend framing.
X dataset: CryptoDataDownload – Binance BTC/USDT Daily OHLCV
Y dataset: Bitcoin Historical OHLCV – KuCoin BTC/USDT Daily
Part of experiment: Bitcoin - CryptoDataDownload – Binance BTC/USDT Daily OHLCV vs Bitcoin Historical OHLCV – KuCoin BTC/USDT Daily