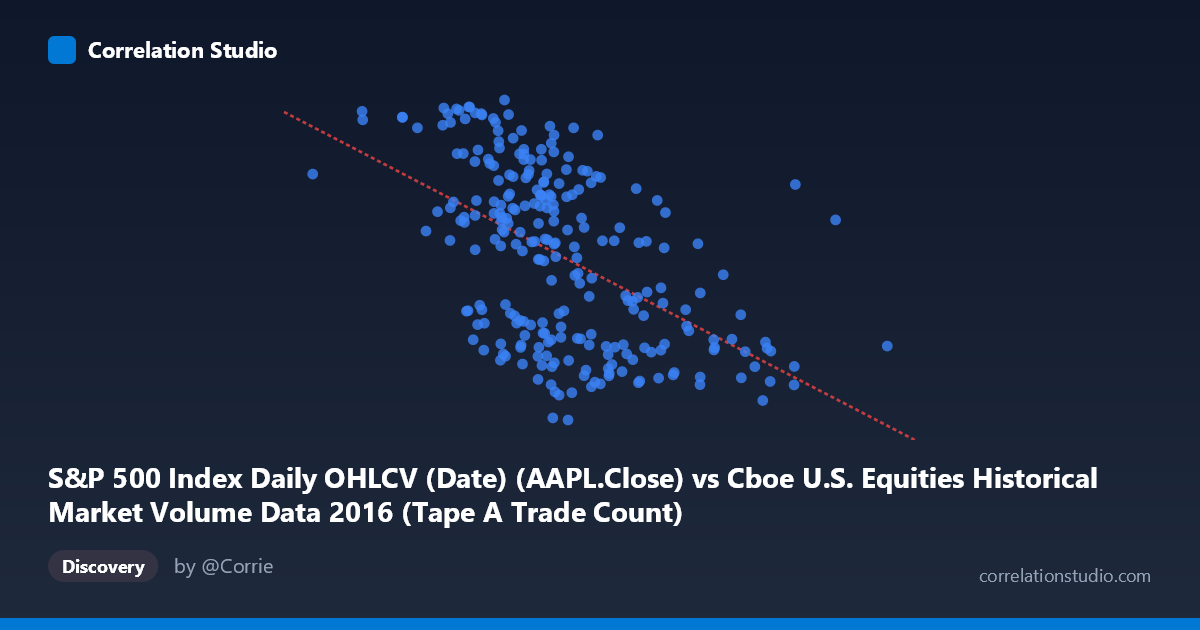
S&P 500 Index Daily OHLCV (Date) (AAPL.Close) vs Cboe U.S. Equities Historical Market Volume Data 2016 (Tape A Trade Count)
- Pearson correlation (r)
- -0.518
- Spearman correlation
- -0.5403
- p-value
- 0
- Sample size (n)
- 252
- 95% confidence interval
- -0.603 to -0.4214
- Granger causality
- None
- Granger optimal lag
- 1
AI analysis
Analysis: AAPL Closing Price vs. Cboe Tape A Trade Count (2016)
Relationship Overview The scatterplot reveals a moderate negative relationship between Apple's closing price (X-axis) and Cboe's Tape A trade count (Y-axis) across 252 trading days in 2016. As AAPL's stock price increased from roughly $540 to $2,497 (noting these appear to be scaled or adjusted values), trade count on Tape A tended to decline. The linear regression equation y = -1.33×10⁻⁵x + 123.1 captures this downward trend, though the scatter around the regression line is substantial, indicating the relationship is real but far from deterministic. The data points are spread across a wide X range, with most observations clustering between roughly 1,000,000 and 1,700,000 on the X-axis, where Y values span the full range of approximately 90–118.
Correlation Strength and Statistical Significance The Pearson correlation of r = -0.518 indicates a moderate negative association. However, the coefficient of determination r² = 0.268 is the more practically meaningful statistic — it tells us that only 26.8% of the variance in Tape A trade count is explained by AAPL's closing price, meaning roughly 73% of the variation remains unexplained by this relationship alone. The 95% confidence interval of [-0.603, -0.421] is entirely negative and does not cross zero, and the p-value is effectively zero, confirming this correlation is highly statistically significant and almost certainly not a chance finding given n = 252. That said, statistical significance does not imply practical causation or strong predictive power. Critically, Granger causality tests show no significant directional predictability in either direction (X→Y: F = 0.42, p = 0.52; Y→X: F = 1.34, p = 0.25), meaning past values of AAPL's price do not help forecast trade counts, nor vice versa, at the tested lag of 1 period. This is an important caveat: the correlation is a contemporaneous statistical association, not a temporal predictive one.
Notable Patterns, Clusters, and Outliers Several features stand out in the sample points provided. There is a visible cluster of high-Y, low-X values — for instance, the point (1,000,524, 117.06) and (1,053,273, 113.58) represent relatively low AAPL prices paired with elevated trade counts, consistent with the negative trend. Conversely, points like (2,013,606, 96.30) and (1,860,056, 94.09) anchor the high-X, low-Y region. However, there is considerable vertical spread at any given X value — for example, near X ≈ 1,350,000–1,400,000, Y values range from ~90 to ~115, suggesting substantial noise or other drivers. A few potential outliers exist at the extremes of the X range (notably around X = 540,338 and X = 2,497,319), which could disproportionately influence the regression slope and should be examined. There is no strong visual evidence of a non-linear (e.g., U-shaped) pattern, though the wide scatter leaves room for structural breaks, particularly around mid-year market events in 2016.
Confounding Factors and Caveats Several important caveats apply. First, the dataset appears to mix two fundamentally different phenomena: a single stock's price (AAPL) and aggregate market-wide trade count on Tape A (which covers NYSE-listed securities broadly). The negative correlation may reflect a shared temporal trend rather than a direct mechanism — AAPL rose through much of 2016's second half, while overall market trade volumes fluctuated seasonally or in response to macro events (Brexit, U.S. election). Second, the X-axis label and data values (range ~540K–2.5M) seem unusually large for a closing price but could represent a composite or transformed variable, warranting clarification on data provenance. Third, the Granger causality failure at lag 1 suggests any apparent correlation may be driven by concurrent macro factors (volatility regimes, VIX levels, Fed announcements) affecting both variables simultaneously rather than one driving the other. Fourth, with N = 506 implied but n = 252 paired observations, sample construction deserves scrutiny for potential selection bias.
Actionable Insights and Further Investigation Given these findings, several next steps are warranted. First, incorporate additional control variables — particularly the VIX (market volatility index) and overall S&P 500 level — to test whether the AAPL–trade count correlation survives multivariate adjustment. Second, test Granger causality at multiple lags (e.g., 2–5 periods) rather than only lag 1, as market microstructure effects sometimes manifest over slightly longer horizons. Third, segment the data by market regime (pre- vs. post-U.S. election in November 2016) to test whether the correlation is structurally stable or driven by one specific period. Fourth, consider replacing AAPL close price with AAPL trading volume or market cap as the X variable, which would be more theoretically motivated for explaining exchange-level trade counts. Finally, a rolling correlation analysis over 30- or 60-day windows would reveal whether the r = -0.52 figure is stable year-round or concentrated in specific periods, which would significantly sharpen the practical interpretation of this relationship.
X dataset: Cboe U.S. Equities Historical Market Volume Data 2016
Y dataset: S&P 500 Index Daily OHLCV (Date)
Part of experiment: Daily - Cboe U.S. Equities Historical Market Volume Data 2016 vs S&P 500 Index Daily OHLCV (Date)