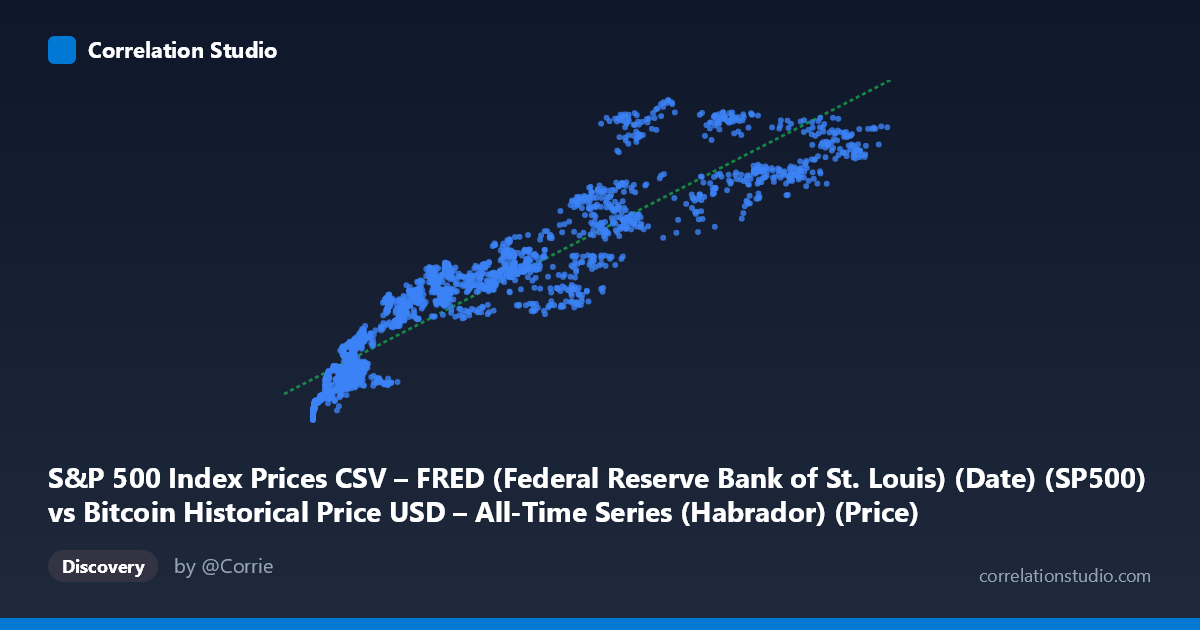
S&P 500 Index Prices CSV – FRED (Federal Reserve Bank of St. Louis) (Date) (SP500) vs Bitcoin Historical Price USD – All-Time Series (Habrador) (Price)
- Pearson correlation (r)
- 0.9363
- Spearman correlation
- 0.9595
- p-value
- 0
- Sample size (n)
- 2395
- 95% confidence interval
- 0.9311 to 0.941
- Granger causality
- None
- Granger optimal lag
- 10
AI analysis
Analysis: Bitcoin Price vs. S&P 500 Index
1. What the Visualization Reveals
Despite the axis labels appearing swapped in the metadata (the data clearly shows Bitcoin price on the X-axis, ranging into six figures, plotted against S&P 500 levels on the Y-axis, which stay within the 2000–7000 range), the scatterplot shows a strong, consistent upward trend: as Bitcoin's price rises, the S&P 500 index level also tends to rise. The relationship is not perfectly linear — points at low Bitcoin values (under ~$15,000) cluster tightly with S&P 500 values in the 2100–3400 range, while higher Bitcoin values show a steeper, more spread-out ascent toward S&P levels of 5000–7000+, suggesting the relationship may curve or accelerate at higher X values.
2. Strength, Direction, and Statistical Meaning
The correlation coefficient (r = 0.937) indicates a very strong positive linear association, and r² = 0.879 means roughly 88% of the variance in the S&P 500's level is statistically "explained" by Bitcoin's price in this linear model. The confidence interval [0.932, 0.942] is tight, and the p-value is effectively zero — meaning this correlation is not a statistical fluke given this sample. However, statistical significance here reflects the time-trend nature of both series, not necessarily a causal economic mechanism. Critically, the Granger causality tests show no significant predictive direction: Bitcoin does not significantly Granger-cause the S&P 500 (p = 0.0585, borderline) and the S&P 500 does not Granger-cause Bitcoin (p = 0.208) at the tested lag. This is an important caveat — a high r² does not imply either asset leads or predicts the other in time; it more likely reflects that both series have trended upward over the same multi-year period (2016–2026).
3. Notable Patterns and Features
The data suggests a piecewise or non-linear structure: a dense low-range cluster (X < 15,000, Y ≈ 2100–3400) corresponding to Bitcoin's earlier price regime and a calmer pre-2020 S&P 500, followed by a more dispersed, steeper-sloped upper cluster (X 40,000) where Y values scatter more widely (e.g., X≈60,000 pairs with Y from 5434 to 6902 to 6345). This heteroscedasticity — variance increasing with X — implies the linear fit (y = 0.0389x + 2659) understates the relationship at low X and may overstate precision at high X. The pattern is consistent with two variables independently undergoing long-term secular bull markets rather than one directly tracking the other tick-by-tick.
4. Confounding Factors and Caveats
This is a textbook case of spurious correlation risk via shared time trend: both Bitcoin and the S&P 500 have risen substantially from 2016–2026, driven by largely unrelated fundamentals — Bitcoin by adoption/speculation cycles and halving events, the S&P 500 by corporate earnings, interest rates, and macroeconomic growth. Common confounders include overall market liquidity, monetary policy (near-zero rates 2020–2021 inflating both risk assets), inflation, and general risk appetite. Neither series being differenced or detrended for this analysis means the correlation largely reflects co-trending, not a stable structural relationship — a well-known pitfall when correlating two non-stationary time series.
5. Actionable Insights
Before drawing investment or predictive conclusions, analysts should: (1) detrend or difference both series (e.g., use daily/monthly returns rather than levels) and recompute correlation — this typically reveals a much weaker relationship once the shared trend is removed; (2) test for cointegration rather than relying on simple correlation, given both are non-stationary price/index series; (3) segment the analysis by market regime (e.g., 2016–2019 vs. 2020–2022 vs. 2023–2026) to check if the relationship is stable or driven by specific episodes like the 2020 pandemic liquidity surge; and (4) treat the Granger causality result as the more decision-relevant finding — since neither series robustly leads the other, this correlation should not be used for short-term predictive trading strategies between Bitcoin and equities.
X dataset: Bitcoin Historical Price USD – All-Time Series (Habrador)
Y dataset: S&P 500 Index Prices CSV – FRED (Federal Reserve Bank of St. Louis) (Date)
Part of experiment: Bitcoin - Bitcoin Historical Price USD – All-Time Series (Habrador) vs S&P 500 Index Prices CSV – FRED (Federal Reserve Bank of St. Louis) (Date)