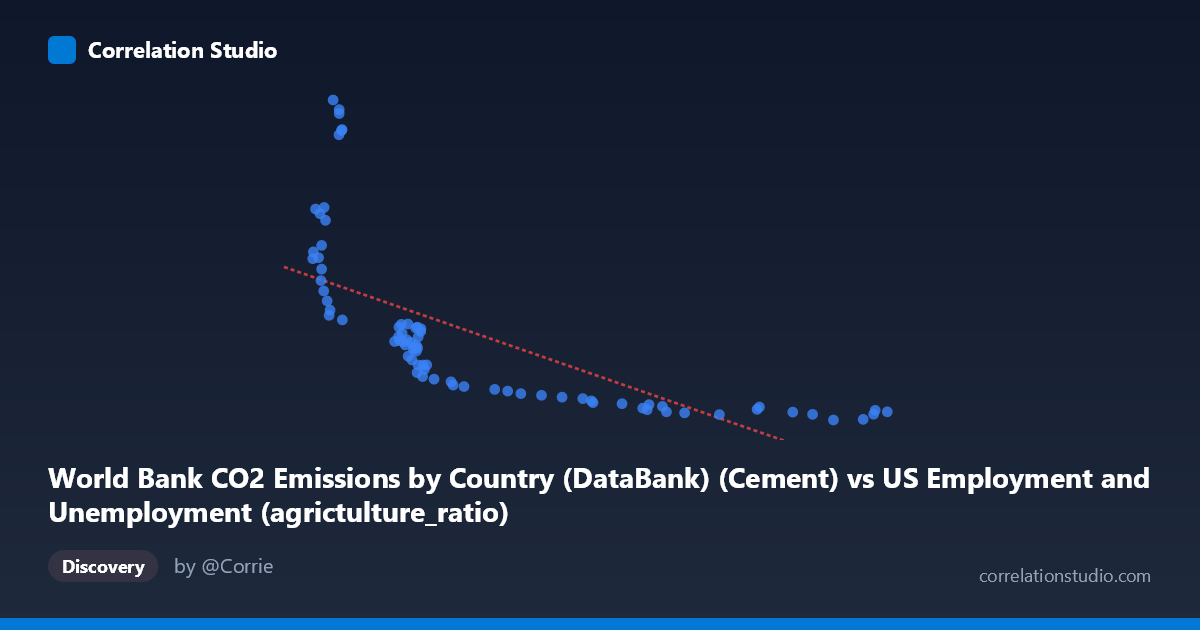
World Bank CO2 Emissions by Country (DataBank) (Cement) vs US Employment and Unemployment (agrictulture_ratio)
- Pearson correlation (r)
- -0.6884
- Spearman correlation
- -0.9463
- p-value
- 0
- Sample size (n)
- 80
- 95% confidence interval
- -0.7888 to -0.5522
- Granger causality
- None
- Granger optimal lag
- 10
- Time coverage
- 1941-01-01 to 2020-01-01
AI analysis
Scatterplot Analysis: Cement CO2 Emissions vs. US Agriculture Employment Ratio
1. Visual Relationship Overview
The scatterplot reveals a strong negative relationship between World Bank cement CO2 emissions and the US agriculture employment ratio, with Y values declining sharply as X increases from roughly 2,000 to 4,500 units, then flattening into a dense cluster of low Y values for X above 5,000. This hyperbolic or exponential decay pattern is immediately visually apparent — the relationship is clearly not linear despite a linear regression being fitted. The data separates into two visually distinct zones: a high-variance, steeply declining region at lower X values (roughly 2,095–4,000) and a compressed, low-variance plateau at higher X values (5,000–9,250), where agriculture ratios consistently fall below ~300 regardless of further increases in cement emissions.
2. Correlation Strength, Direction, and Statistical Interpretation
The Pearson correlation of r = -0.6884 indicates a moderately strong negative association, with r² = 0.4739 meaning that approximately 47.4% of the variance in the US agriculture employment ratio is statistically explained by cement CO2 emissions under a linear model. While nearly half of variance explained sounds meaningful, the linear model is almost certainly underperforming given the non-linear structure — the note that Spearman ρ exceeds Pearson r confirms this, suggesting a logarithmic or power-law fit would capture substantially more variance. The 95% confidence interval for r of [-0.7888, -0.5522] is reasonably tight and excludes zero, and the p-value of 1.711E-12 confirms the correlation is highly statistically significant — this is not a chance finding across the 80 paired observations spanning 1941–2020.
However, the Granger causality results fundamentally complicate any causal interpretation. Neither direction achieves significance at the conventional 0.05 threshold: X→Y yields F = 0.6764, p = 0.7407 (no predictive signal whatsoever), and Y→X yields F = 1.9829, p = 0.0559 (marginally suggestive but not significant, even at a relaxed threshold). The optimal lag of 10 periods was required to find even this marginal signal, which itself raises overfitting concerns. In practical terms, cement CO2 emissions do not temporally predict the agriculture employment ratio, and vice versa — both variables are almost certainly being driven by a common underlying force (long-run economic modernization) rather than causing one another.
3. Notable Patterns, Clusters, and Outliers
Several features stand out clearly. First, there is a tight high-density cluster between X = 3,100–3,600 and Y = 400–850, representing a substantial portion of the sample likely corresponding to mid-century decades. Second, a cluster of extreme high-Y outliers appears at very low X values (X ≈ 2,300–2,465, Y = 870–2,608), with points like (2,349; 2,608.93), (2,425; 2,532.94), and (2,460; 2,374.89) sitting far above the regression line — these likely represent the earliest years of the dataset (early 1940s) when agricultural employment was still dominant in the US workforce. Third, the right tail (X 6,000) is diffuse but consistently low in Y, with values clustering below 250, reflecting modern decades where agriculture's employment share has reached near-floor levels. There are no extreme X-axis outliers per se, but the asymmetry between the high-variance left and low-variance right is a defining structural feature.
4. Confounding Factors and Caveats
The most critical caveat is that both variables are proxies for the same secular trend: long-run economic development and industrialization. As economies modernize, agricultural employment shrinks (structural transformation) and industrial activity — including cement production and associated CO2 — grows. This means the observed correlation almost certainly reflects shared temporal autocorrelation with time acting as a confounding variable, rather than any direct mechanistic link between cement emissions and farm employment. The dataset mismatch (X labeled as US Employment dataset but referencing cement CO2; Y labeled as CO2 dataset but referencing agriculture ratio) also warrants careful scrutiny — the cross-dataset join may introduce alignment artifacts. Additionally, the non-linearity means the linear r² of 47.4% is a lower bound on the true associative relationship, and the regression equation y = -0.220608x + 1,672.39 should not be used for prediction, particularly at extreme X values where it would yield nonsensical negative Y estimates.
5. Actionable Insights and Further Investigation
Given the non-linear decay structure, the immediate next step should be fitting a logarithmic or power-law regression (e.g., Y = a·X^b or Y = a·ln(X) + b), which would likely raise explained variance well above 60–70% and provide a more honest model. More importantly, time should be explicitly controlled — a partial correlation analysis holding year constant, or a detrended cross-correlation, would reveal whether any relationship persists beyond shared modernization trends. Researchers should also consider structural break analysis around major economic disruptions (WWII mobilization, 1970s oil shocks, 2008 recession) that may explain the outlier cluster at low X values. Finally, since Granger causality was insignificant in both directions, any policy or interpretive narrative linking cement production to agricultural labor markets should be abandoned — the more productive framing is using both variables as co-indicators of industrial transition, potentially useful for building composite development indices or validating historical economic periodization.
X dataset: US Employment and Unemployment
Y dataset: World Bank CO2 Emissions by Country (DataBank)
Part of experiment: Yearly - US Employment and Unemployment vs World Bank CO2 Emissions by Country (DataBank)