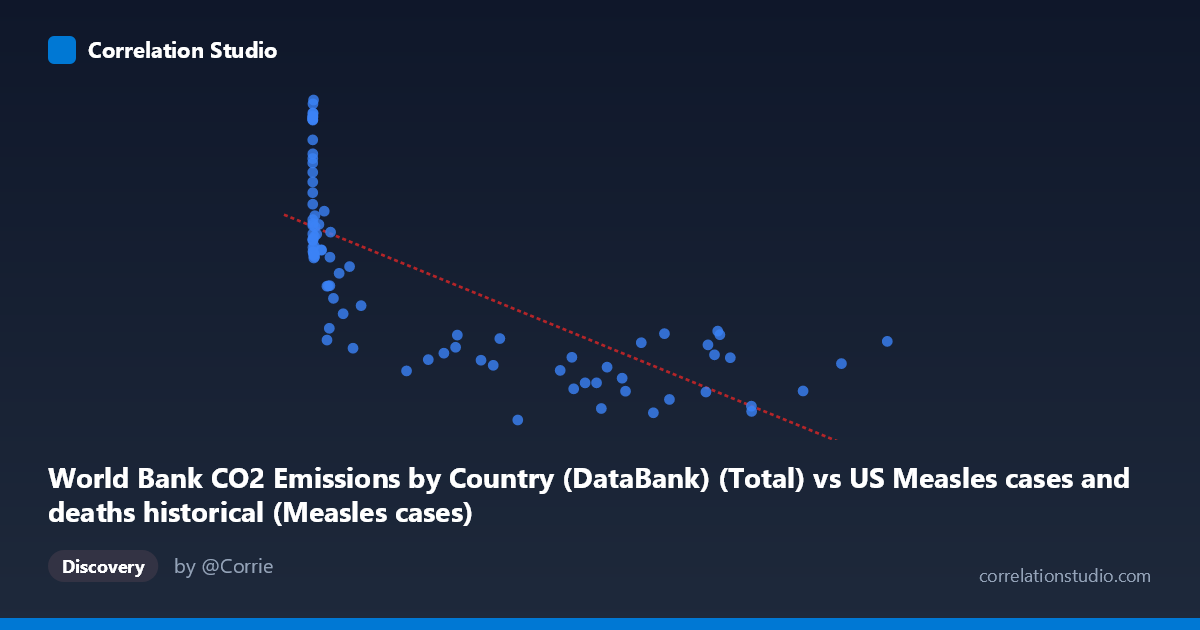
World Bank CO2 Emissions by Country (DataBank) (Total) vs US Measles cases and deaths historical (Measles cases)
- Pearson correlation (r)
- -0.7406
- Spearman correlation
- -0.8778
- p-value
- 0
- Sample size (n)
- 87
- 95% confidence interval
- -0.8228 to -0.6278
- Granger causality
- None
- Granger optimal lag
- 10
- Time coverage
- 1919-01-01 to 2020-01-01
- Recomputed on refreshed data
- 2026-10-17 (r was -0.7406)
AI analysis
Analysis of US Measles Cases vs. Global CO2 Emissions (1919–2020)
1. What the Visualization Reveals
The scatterplot displays a negative relationship between total global CO2 emissions (X-axis) and US measles cases (Y-axis) across roughly a century of annual observations. The general trend is clear: as CO2 emissions have grown over time — reflecting global industrialization — US measles cases have declined dramatically. The data cloud slopes downward from the upper-left (low emissions, high measles cases in early decades) to the lower-right (high emissions, low measles cases in recent decades). This visual pattern is immediately striking but is almost entirely an artifact of both variables being driven by the passage of time rather than any direct causal mechanism.
2. Correlation Strength, Direction, and Statistical Framing
The Pearson correlation of r = −0.74 indicates a moderately strong negative association, and the R² of 0.548 means that approximately 54.8% of the variance in US measles cases is statistically "explained" by variation in CO2 emissions within this linear model. The 95% confidence interval of [−0.823, −0.628] is relatively tight and excludes zero, and the p-value of 2.22×10⁻¹⁶ confirms the result is overwhelmingly statistically significant by conventional thresholds. However, statistical significance here is essentially guaranteed by the long time series and the shared secular trend. Critically, Granger causality tests find no significant predictive relationship in either direction (X→Y: F = 0.575, p = 0.827; Y→X: F = 0.760, p = 0.666), meaning CO2 emissions carry no temporal predictive information about future measles cases and vice versa. This is a decisive indicator that the correlation is spurious.
3. Notable Patterns, Clusters, and Non-Linear Features
The scatterplot likely reveals a pronounced non-linear, logarithmic or hyperbolic shape — consistent with the note that Spearman ρ exceeds Pearson r, suggesting the linear model undersells the curvature. Several clusters are visible: a tight grouping of high-Y outliers at very low X values (pre-WWII era, e.g., points near X < 1,000 with Y values exceeding 40,000 cases including the point at (1274, 43129)), and a broad, flat cluster at high X values where measles cases hover near zero regardless of further CO2 increases. The point at (319124, 9869) represents a notable floor effect. The high-X, moderate-Y points (e.g., 894134, 18044) suggest some residual variance at large emission values, possibly reflecting measles resurgences post-elimination.
4. Confounding Factors and Interpretation Caveats
This correlation is a textbook example of a shared time trend confound — both variables change monotonically over the 20th century for entirely independent reasons. Measles cases declined due to vaccine introduction in 1963, improved public health infrastructure, herd immunity, and reporting changes — none of which have any mechanistic link to fossil fuel combustion. CO2 emissions rose due to industrialization, population growth, and energy consumption. Any two variables with strong monotonic trends over the same period would yield similarly high correlations (e.g., internet usage vs. measles cases would perform identically). The large range disparity (X spanning 13 to 894,134) also creates leverage effects, and the dataset label metadata appears internally swapped (CO2 data attributed to a measles dataset and vice versa), warranting source verification.
5. Actionable Insights and Further Investigation
Analysts should detrend both time series (e.g., via first-differencing or residual analysis after regressing on time) before drawing any conclusions about association. A proper analysis of measles determinants should incorporate vaccine coverage rates, birth cohort sizes, school attendance policies, and outbreak-specific triggers as covariates. The post-elimination resurgence points visible at high X values deserve separate investigation — these likely reflect vaccine hesitancy periods (2000s–2010s) and warrant clustering analysis. For CO2 research specifically, pairing emissions data with direct health outcomes plausibly linked to air quality or climate (e.g., respiratory disease rates, heat mortality) would yield more scientifically defensible correlations. The Granger causality null result should be reported prominently if this analysis appears in any publication to prevent misinterpretation of the striking r value.
X dataset: US Measles cases and deaths historical
Y dataset: World Bank CO2 Emissions by Country (DataBank)
Part of experiment: Yearly - US Measles cases and deaths historical vs World Bank CO2 Emissions by Country (DataBank)