Cboe U.S. Equities Historical Market Volume Data 2022 (Tape A Trade Count) vs CryptoDataDownload – Binance BTC/USDT Daily OHLCV (Unix)
- Pearson correlation (r)
- -0.4391
- Spearman correlation
- -0.4329
- p-value
- 0
- Sample size (n)
- 251
- 95% confidence interval
- -0.5339 to -0.3334
- Granger causality
- None
- Granger optimal lag
- 10
- Time coverage
- 2022-01-03 to 2022-12-30
AI analysis
Analysis: Cboe Trade Count vs. Binance BTC/USDT Volume (2022)
1. What the Visualization Reveals
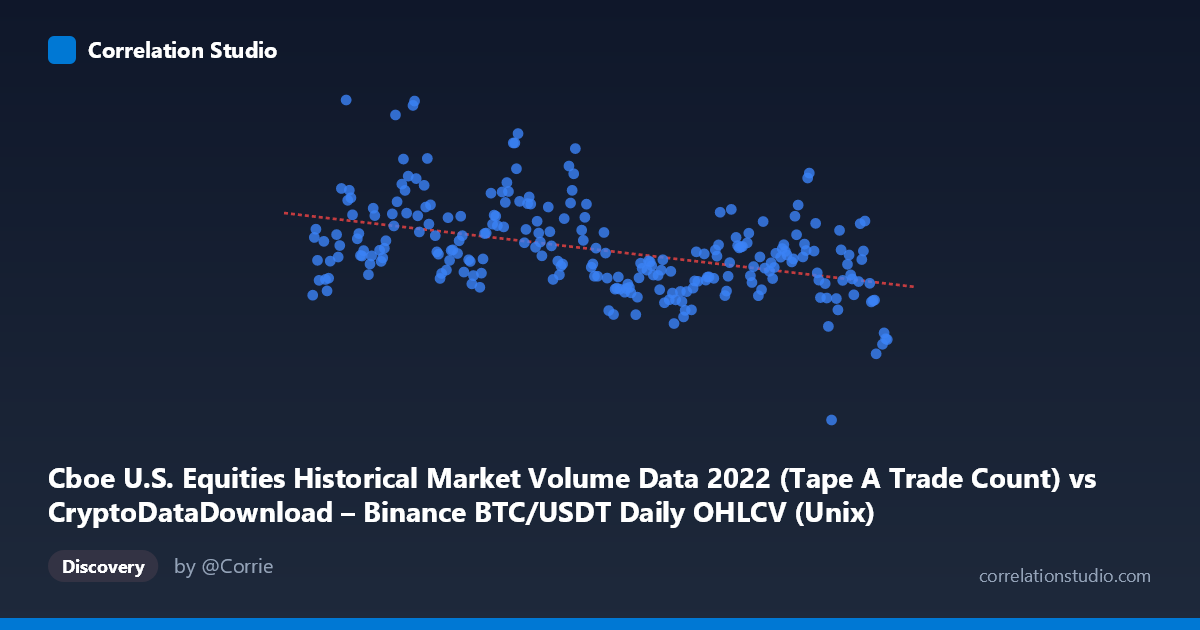
The scatterplot shows a moderate negative relationship between the two time-series variables across the 2022 calendar year: as one metric (X, labeled as Cboe trade count but scaled as Unix timestamps) increases, the other (Y, Binance BTC/USDT volume-related metric) tends to decrease. However, the scatter is wide and noisy — points are dispersed broadly around the downward-sloping regression line rather than hugging it tightly. This is consistent with a real but modest linear tendency rather than a tight, deterministic relationship. Both series also show clear internal volatility (e.g., Y ranges from ~696K to ~2.78M, more than a 4x swing), suggesting each is driven by its own independent dynamics.
2. Strength, Direction, and Statistical Confidence
The correlation coefficient (r = -0.439) indicates a weak-to-moderate negative relationship. Squaring this (r² = 0.193) shows that only about 19% of the variance in Y is explained by X — meaning roughly 81% of Y's movement is driven by other factors entirely. The 95% confidence interval [-0.534, -0.333] is reasonably tight and does not cross zero, and the p-value (2.98E-13) is highly significant, confirming this negative correlation is not due to chance in this sample. However, statistical significance ≠ practical strength: with n=251, even modest correlations become highly significant, but the low r² means this relationship has limited predictive power on its own.
Critically, the Granger causality tests show no significant predictive direction in either direction (X→Y: p=0.467; Y→X: p=0.323) at the optimal lag of 10 periods. This means neither series meaningfully helps forecast future values of the other based on past values — the correlation appears to be contemporaneous/coincidental rather than a lead-lag causal relationship. This is an important caveat: a significant cross-sectional correlation coexisting with no Granger causality often signals a spurious or confounded relationship, frequently driven by shared trends (e.g., both series drifting over calendar time) rather than genuine interaction.
3. Notable Patterns and Outliers
Visually, there appear to be a few high-leverage outliers — data points where Y exceeds 2.4–2.7M (e.g., 2,774,256 and 2,562,255) occur at X-values clustered in the February–June range, while the bulk of lower Y-values (under 1.6M) cluster in the August–December range. This suggests a temporal segmentation rather than a smooth linear relationship: Y seems structurally higher in H1 2022 and lower in H2 2022, which would mechanically produce a negative correlation with X (since X is a timestamp-like variable) without implying any causal or economically meaningful link between "trade count" and "BTC volume." This calendar-drift artifact is the most important pattern to interpret.
4. Confounding Factors and Caveats
The biggest red flag is that the X variable is described as a trade-count column but its numeric range (1.64–1.67 trillion) matches Unix millisecond timestamps, not realistic equity trade counts. This suggests a column/label mismatch or data-pipeline error, where X is likely just encoding calendar time rather than actual market activity. If so, the "correlation" is essentially measuring how Y trended over the course of 2022 (declining, consistent with the broader 2022 crypto bear market) rather than any genuine link between Cboe equity activity and Binance BTC volume. Additional confounders include: both markets being influenced by macro conditions in 2022 (Fed rate hikes, risk-off sentiment affecting both equities and crypto simultaneously), and potential unit/scaling issues given the axis labels are swapped relative to their dataset descriptions.
5. Suggested Next Steps
Before drawing any economic conclusions, verify the column mapping and units for X — confirm whether it truly represents Cboe Tape A trade counts or is inadvertently a timestamp field. If X is genuinely a trade-count metric, re-run the correlation controlling for calendar time/trend (e.g., detrend both series or use year-over-year differences) to isolate any relationship beyond shared seasonality. Given the null Granger causality result, this pairing is not suitable for building predictive trading signals in either direction. Instead, consider testing for common macro drivers (VIX, Fed rate decisions, overall market risk sentiment) that could jointly explain movements in both equity trading activity and crypto volume, which would provide more actionable insight than treating this as a direct bivariate relationship.
X dataset: CryptoDataDownload – Binance BTC/USDT Daily OHLCV
Y dataset: Cboe U.S. Equities Historical Market Volume Data 2022
Part of experiment: Bitcoin - CryptoDataDownload – Binance BTC/USDT Daily OHLCV vs Cboe U.S. Equities Historical Market Volume Data 2022