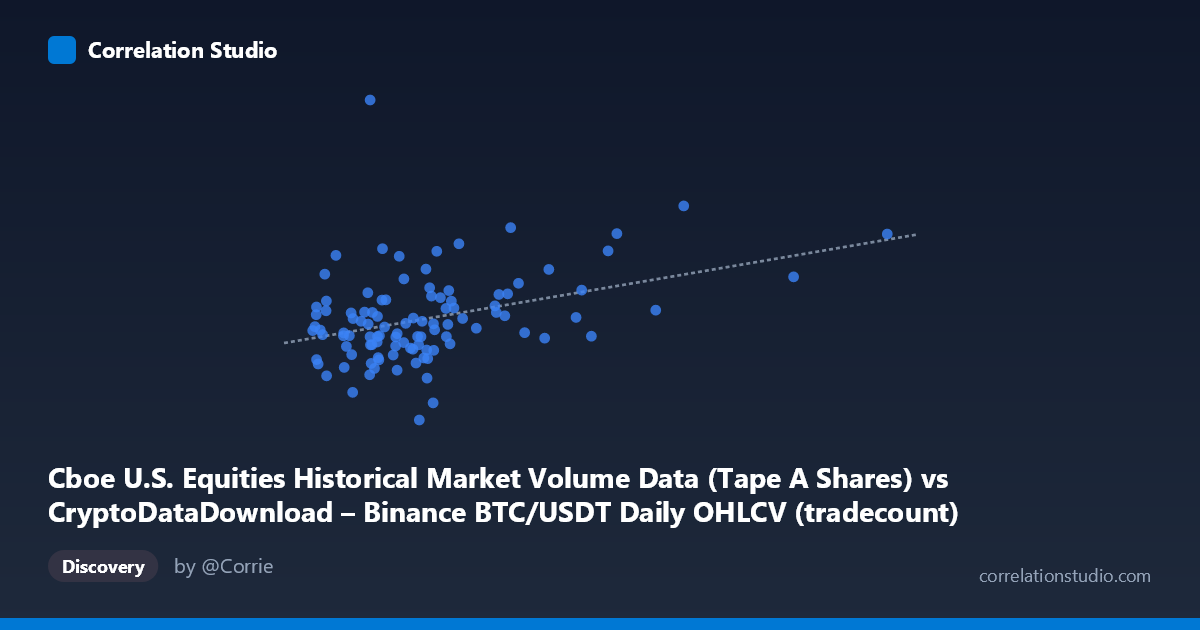
Cboe U.S. Equities Historical Market Volume Data (Tape A Shares) vs CryptoDataDownload – Binance BTC/USDT Daily OHLCV (tradecount)
- Pearson correlation (r)
- 0.3761
- Spearman correlation
- 0.3326
- p-value
- 0.000083
- Sample size (n)
- 104
- 95% confidence interval
- 0.1978 to 0.5303
- Granger causality
- None
- Granger optimal lag
- 10
- Time coverage
- 2026-01-02 to 2026-06-25
- Recomputed on refreshed data
- 2026-10-23 (r was 0.3761)
AI analysis
Analysis: Cboe Tape A Volume vs. Binance BTC/USDT Tradecount
1. Overall Relationship
The scatterplot shows a moderate positive linear relationship between Cboe U.S. Equities Tape A share volume (X) and Binance BTC/USDT daily tradecount (Y). As Cboe volume increases, tradecount tends to rise as well, though the relationship is noisy — points are widely scattered around the regression line (y = 7.18x + 246.25M) rather than tightly clustered along it. The majority of X observations fall in a compressed range (roughly 2.3M–8.5M), with a handful of high-leverage points extending out to 13–15.4M, which likely exert outsized influence on the fitted slope.
2. Strength, Direction, and Statistical Confidence
The correlation coefficient (r = 0.494) indicates a moderate positive association, but r² = 0.244 means only about 24% of the variance in tradecount is explained by Cboe volume — leaving roughly 76% attributable to other factors or noise. The 95% CI [0.319, 0.636] is reasonably tight and entirely positive, and the p-value (7.7×10⁻⁷) confirms the correlation is statistically significant and not due to chance. However, statistical significance here reflects a real but modest linear association — not a strong predictive relationship. Critically, the Granger causality tests show no significant directional predictability in either direction (X→Y: p=0.082; Y→X: p=0.372) at the optimal 10-period lag. This means that despite the contemporaneous correlation, past values of one series do not meaningfully help forecast future values of the other — the relationship appears to be a same-period co-movement rather than a lead-lag dynamic.
3. Notable Patterns and Outliers
Several features stand out: a cluster of low-X points (2.3–5M) spans a very wide Y range (199M–360M), suggesting substantial unexplained variance at low volume levels. A few clear outliers exist — notably (4695523, 198955429.77), the lowest Y value in the dataset despite mid-range X, and (10724002, 379647013.60), the highest Y value, paired with a high but not extreme X. The three highest-X points (10.7M, 13.2M, 15.4M) all correspond to elevated Y values (292M–380M), which helps drive the positive slope but represents a thin, sparse tail with limited data density — any inference about the relationship at high X should be treated cautiously due to potential leverage effects.
4. Confounding Factors and Caveats
This pairing is unusual: it compares a traditional equities market volume metric (Cboe Tape A) against a cryptocurrency trading activity metric (Binance tradecount), two structurally different markets. Any correlation is more plausibly driven by shared macro factors — such as overall market-wide risk sentiment, volatility regimes, trading days/holidays, or broad liquidity conditions — rather than a direct causal mechanism linking equities volume to crypto trade counts. The modest sample size (n=90 paired points from a population of 1,980) and the short time coverage (Jan–May 2026, roughly 5 months) limit generalizability. Additionally, both series may have their own autocorrelation and trends (e.g., growing crypto adoption over time) that could create spurious correlation without genuine interdependence.
5. Suggestions for Further Investigation
Given the weak Granger causality results, further work should test for a common latent driver — e.g., include a market volatility index (VIX) or aggregate trading volume across asset classes as a control variable in a multivariate model. It would also be valuable to re-run analysis on log-transformed or detrended series to remove any shared time trend, examine whether the relationship holds up when high-leverage points (X 10M) are excluded, and extend the time window beyond 5 months to test robustness across different market regimes (bull/bear cycles). Given r² of only 24%, this relationship alone should not be used for forecasting one series from the other; it may be more useful as one input among several in a broader cross-market sentiment model.
X dataset: CryptoDataDownload – Binance BTC/USDT Daily OHLCV
Y dataset: Cboe U.S. Equities Historical Market Volume Data
Part of experiment: Bitcoin - CryptoDataDownload – Binance BTC/USDT Daily OHLCV vs Cboe U.S. Equities Historical Market Volume Data