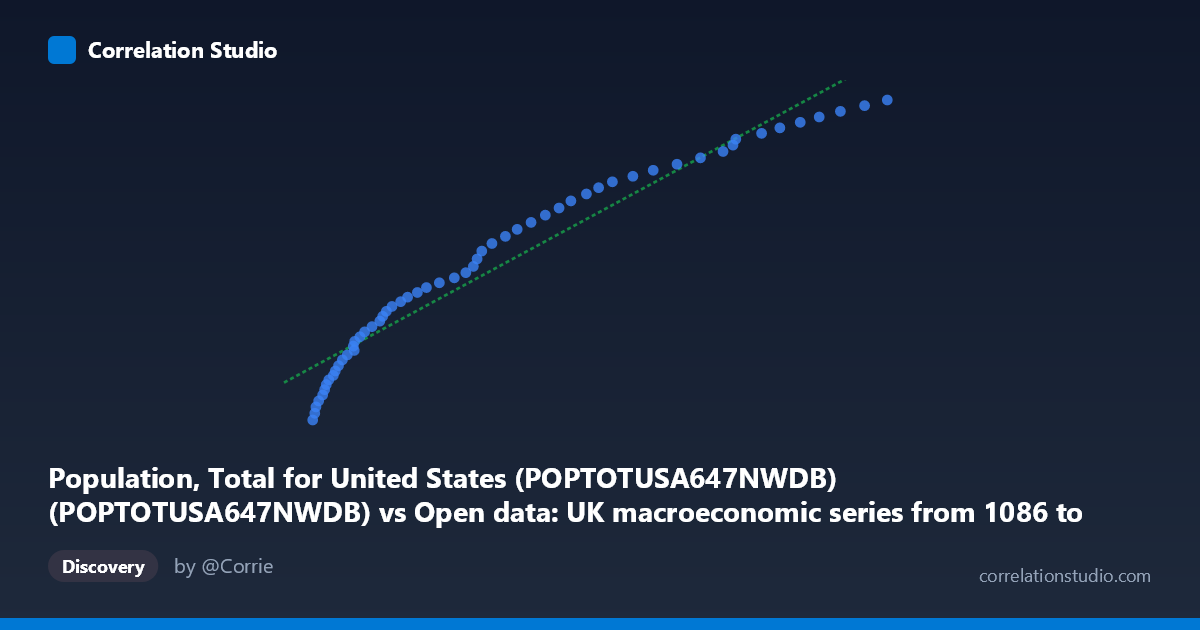
Population, Total for United States (POPTOTUSA647NWDB) (POPTOTUSA647NWDB) vs Open data: UK macroeconomic series from 1086 to present. Bank of England Millennium of Macroeconomic Data. (Year) (value)
- Pearson correlation (r)
- 0.9715
- Spearman correlation
- 0.9999
- p-value
- 0
- Sample size (n)
- 57
- 95% confidence interval
- 0.9518 to 0.9832
- Granger causality
- None
- Granger optimal lag
- 10
AI analysis
Analysis: US Population vs. UK Macroeconomic Data
Relationship Overview The scatterplot reveals a strong, positive, and largely linear relationship between total US population and the UK macroeconomic series (likely UK GDP or a related aggregate given the value range of ~180–324 billion). As US population increases from roughly 50,000 to 469,000 (units likely in thousands, spanning 1960–2016), the UK macroeconomic variable rises correspondingly from approximately 181 billion to 324 billion. The data points trace what appears to be a smooth, near-continuous arc — consistent with two variables that both trend upward over the same historical period rather than exhibiting any dynamic causal interaction.
Correlation Strength and Statistical Interpretation The Pearson correlation of r = 0.9715 is exceptionally strong, and the R² of 0.9437 means that ~94.4% of the variance in the UK macroeconomic series is statistically "explained" by US population. The 95% confidence interval for r of [0.9518, 0.9832] is narrow, and the p-value is effectively zero, confirming this is not a chance result across the 57 paired observations. However, the Granger causality results are unambiguous in their null finding: neither direction (X→Y: F=0.79, p=0.64; Y→X: F=0.87, p=0.57) approaches statistical significance at any conventional threshold, even with an optimal lag of 10 periods. This means that knowing past values of one series provides no additional predictive power for the other beyond what each series already contains — a critical caveat against any causal interpretation.
Patterns, Clusters, and Notable Features The scatter follows a tight, monotonically increasing band with very little scatter around the fitted regression line (y = 333.26x + 187,692,000), consistent with the high R². There is a slight visual suggestion of mild non-linearity or curvature at the upper range of X values (above ~350,000), where the UK variable appears to compress somewhat — possibly reflecting a leveling off or a different growth regime in later decades. No severe outliers are apparent, though the highest-X observations (e.g., 468,775 / 324,353,340 and 452,250 / 321,815,121) cluster near the regression ceiling and warrant closer inspection for leverage effects.
Confounding Factors and Caveats This correlation is almost certainly a textbook example of spurious correlation driven by shared time trends. Both series grow monotonically over the 1960–2016 period simply because they are non-stationary time series trending upward over the same epoch — US population grows steadily due to demographics, while UK macroeconomic aggregates grow due to inflation, real growth, and structural expansion. Any two upward-trending annual series over a 56-year window will tend to correlate strongly. The Granger causality test — which explicitly tests whether temporal information in one series improves forecasts of the other — correctly finds no meaningful temporal predictive relationship, confirming the correlation reflects co-trending rather than any economic or demographic linkage between US population size and UK economic outcomes.
Actionable Insights and Further Investigation The appropriate next step is to detrend or difference both series (e.g., using first differences or log-differences of annual changes) and re-examine the correlation, which would almost certainly collapse dramatically. Researchers should also test for cointegration using Engle-Granger or Johansen procedures to determine whether any long-run equilibrium relationship exists beyond shared trending. If the goal is to understand UK macroeconomic dynamics, far more theoretically grounded predictors — UK domestic population, trade volumes, interest rates, or EU economic conditions — should be explored. This dataset pair serves as a valuable pedagogical illustration of why high R² and low p-values are insufficient evidence of a meaningful relationship without theoretical justification and proper time-series diagnostics.
X dataset: Open data: UK macroeconomic series from 1086 to present. Bank of England Millennium of Macroeconomic Data. (Year)
Y dataset: Population, Total for United States (POPTOTUSA647NWDB)
Part of experiment: Yearly - Open data: UK macroeconomic series from 1086 to present. Bank of England Millennium of Macroeconomic Data. (Year) vs Population, Total for United States (POPTOTUSA647NWDB)