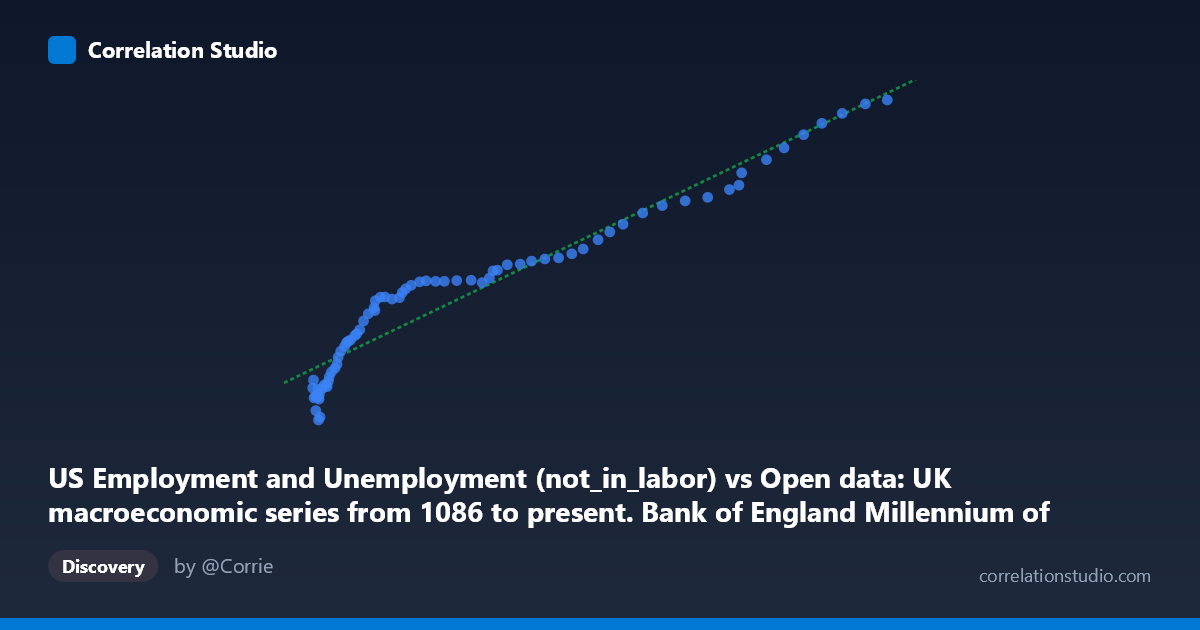
US Employment and Unemployment (not_in_labor) vs Open data: UK macroeconomic series from 1086 to present. Bank of England Millennium of Macroeconomic Data. (Year) (value)
- Pearson correlation (r)
- 0.9625
- Spearman correlation
- 0.9909
- p-value
- 0
- Sample size (n)
- 76
- 95% confidence interval
- 0.9413 to 0.9761
- Granger causality
- None
- Granger optimal lag
- 10
AI analysis
Analysis of US Not-in-Labor-Force vs. UK Macroeconomic Data
1. Overall Relationship The scatterplot reveals a strong, positive, and broadly linear relationship between the US "not in labor force" population (X-axis) and a UK macroeconomic indicator from the Bank of England's Millennium dataset (Y-axis). As the number of Americans outside the labor force increases — ranging from roughly 33,000 to 469,000 (in thousands) — the UK macroeconomic value rises correspondingly from approximately 38,590 to 94,351. The linear regression equation (y = 0.110x + 43,783) fits the data reasonably well across most of the observed range, though some curvature and scatter are visible at the extremes.
2. Correlation Strength and Statistical Framing The correlation is exceptionally strong (r = 0.9625), and the coefficient of determination (R² = 0.9264) indicates that 92.6% of the variance in the UK variable is statistically explained by variation in US not-in-labor-force figures. The 95% confidence interval for r is narrow ([0.9413, 0.9761]), confirming that this high correlation is estimated with considerable precision across the sample of 76 paired annual observations. The p-value of effectively zero rules out chance as an explanation for the association. However, the Granger causality results are telling: neither direction shows significant temporal predictive power (X→Y: F = 1.38, p = 0.22; Y→X: F = 1.06, p = 0.41). This means that despite the striking correlation, neither variable meaningfully predicts the other's future values — a critical warning against causal interpretation.
3. Patterns, Clusters, and Outliers The data cluster densely in the lower-left region (X < ~120,000, Y < ~65,000), reflecting the earlier decades of the time series (post-1941) when both the US labor force non-participation count and the UK indicator were lower. The distribution then stretches diagonally toward the upper right, consistent with long-run secular trends in both series. A few points at the high end — particularly near X ≈ 452,000–469,000 — appear to sit close to but slightly above the regression line, suggesting mild acceleration or nonlinearity at the upper range. No dramatic outliers break the trend, but the scatter widens somewhat at higher X values, hinting at modest heteroscedasticity.
4. Confounding Factors and Caveats The most important caveat here is that this correlation almost certainly reflects shared time trends rather than any meaningful economic linkage between US labor force non-participation and a UK macroeconomic variable. Both series span 1941–2016, and over that 75-year period, virtually any two upward-trending economic or demographic time series will correlate strongly — this is the classic spurious regression problem common in non-stationary time series. The fact that Granger causality is absent in both directions strongly supports this interpretation. Additionally, the datasets originate from entirely different institutional sources (BLS vs. Bank of England), cover different economic systems, and the Y-axis variable is not clearly specified beyond "value," making substantive interpretation difficult. Population growth, inflation, and structural economic changes in both countries likely drive both series independently.
5. Actionable Insights and Further Investigation Given the high probability of spurious correlation, the immediate recommendation is to detrend or difference both series before drawing any conclusions — testing for cointegration (e.g., Engle-Granger or Johansen tests) would clarify whether any genuine long-run equilibrium relationship exists beyond shared trends. Researchers should also clearly identify the UK variable (wage, price index, debt level?) to assess whether an economic theory could plausibly connect it to US labor force participation. Extending the Granger causality test with varied lag structures beyond 10 periods and controlling for common global factors (e.g., oil shocks, financial crises) would further isolate whether any predictive signal exists. Until such tests are conducted, this correlation should be treated as a compelling illustration of spurious time-series correlation rather than evidence of any real-world relationship.
X dataset: Open data: UK macroeconomic series from 1086 to present. Bank of England Millennium of Macroeconomic Data. (Year)
Y dataset: US Employment and Unemployment
Part of experiment: Yearly - Open data: UK macroeconomic series from 1086 to present. Bank of England Millennium of Macroeconomic Data. (Year) vs US Employment and Unemployment