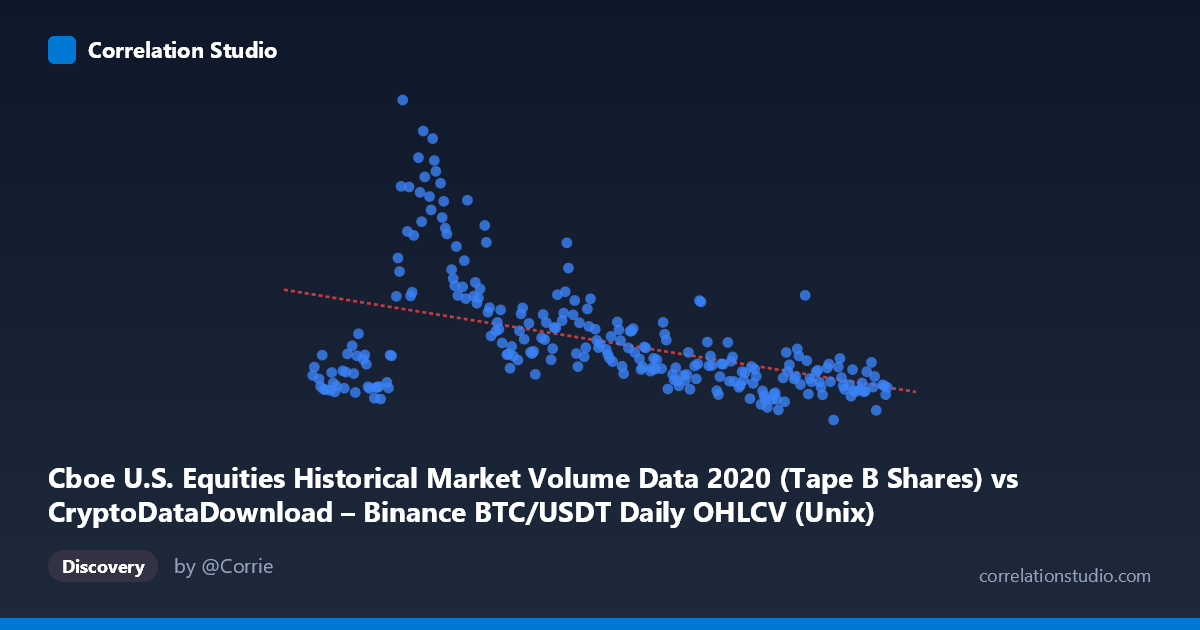
Cboe U.S. Equities Historical Market Volume Data 2020 (Tape B Shares) vs CryptoDataDownload – Binance BTC/USDT Daily OHLCV (Unix)
- Pearson correlation (r)
- -0.4583
- Spearman correlation
- -0.4576
- p-value
- 0
- Sample size (n)
- 253
- 95% confidence interval
- -0.5505 to -0.355
- Granger causality
- None
- Granger optimal lag
- 10
AI analysis
Analysis: BTC/USDT Volume vs. U.S. Equities Market Volume (2020)
1. Overview of the Relationship
The scatterplot depicts a moderate negative relationship between the X variable (labeled here as Cboe equities volume, though the axis metadata appears swapped with the Y label — see caveat below) and Y (BTC/USDT-related metric) across 253 daily observations spanning nearly the entirety of 2020. As X increases, Y tends to decrease, but the relationship is far from tight or deterministic — points are widely scattered around the fitted regression line, particularly at lower X values where Y ranges from roughly 60M to over 340M.
2. Strength, Direction, and Statistical Confidence
The correlation coefficient (r = -0.4583) indicates a moderate negative linear relationship. Squaring this gives R² = 0.21, meaning only about 21% of the variance in Y is explained by X — the remaining ~79% is driven by other factors, noise, or nonlinear dynamics not captured by this simple linear model. The 95% confidence interval [-0.5505, -0.3550] is reasonably tight and entirely negative, and the p-value (1.53×10⁻¹⁴) is highly significant, confirming this correlation is not due to chance in the sampled data. However, statistical significance should not be conflated with practical strength — with R² near 0.21, this is a modest, not dominant, relationship.
Critically, the Granger causality tests show no significant predictive direction in either direction (X→Y: p=0.535; Y→X: p=0.245, at optimal lag 10). This means neither series reliably helps forecast the other's future values based on past values — the correlation appears to be contemporaneous/coincidental rather than causal or lead-lag in nature. This substantially weakens any narrative that one market "drives" the other; they may simply be co-moving due to shared external factors (e.g., macro conditions, COVID-driven volatility) without one leading the other in time.
3. Notable Patterns and Outliers
Several data points show extreme Y values (e.g., 341.7M, 270.9M, 265.1M, 262.3M, 229.8M) clustered in the March–April 2020 timeframe based on the timestamps — this aligns with the COVID-19 market crash and its aftermath, a period of extraordinary volatility and volume across both crypto and equities markets. These high-Y outliers likely exert significant leverage on the regression line and may be inflating the apparent correlation. Excluding this volatility cluster would likely reduce both the slope magnitude and R². The bulk of observations (outside this crisis window) cluster in a tighter, less correlated band (Y between 60M–160M), suggesting the relationship may be regime-dependent rather than stable throughout the year.
4. Confounding Factors and Caveats
- Regime-dependent correlation: The relationship is likely not stationary — it may be an artifact of the March 2020 crash period when both crypto and equity volumes spiked simultaneously due to a common shock (pandemic panic), rather than a structural economic link. - Axis/label ambiguity: The provided axis descriptions appear to have X and Y column names swapped (X is labeled with the Cboe dataset name but describes BTC data, and vice versa) — this should be verified before drawing directional conclusions. - No causal mechanism established: Lack of Granger causality reinforces that this is likely a spurious or confounded correlation rather than one series informing the other. - Aggregation mismatches: Crypto trades 24/7 while equities have defined session hours; volume definitions (shares/contracts vs. crypto units) differ substantially and are not directly comparable in scale or meaning. - Omitted variables: Broader market volatility indices (VIX), macro liquidity conditions, or retail trading activity surges (both retail crypto and retail equity trading spiked in 2020) could be common drivers.
5. Recommendations for Further Investigation
1. Segment by regime: Re-run the correlation excluding the Feb–April 2020 crisis window to test whether the relationship holds in "normal" periods or is entirely crisis-driven. 2. Control for volatility: Introduce VIX or BTC realized volatility as a covariate to test if the correlation is confounded by a shared volatility/fear factor. 3. Verify units and axis labels: Confirm that the described column mapping is correct given the apparent metadata swap. 4. Test nonlinear/lagged models: Given the null Granger result at lag 10, consider testing shorter lags or nonlinear causality methods (e.g., transfer entropy) since simple linear Granger models may miss more complex dependencies. 5. Treat as descriptive, not predictive: Given weak R² and no Granger causality, avoid using this relationship for forecasting; it may be more useful for descriptive/backward-looking narrative about co-occurring market stress episodes.
X dataset: CryptoDataDownload – Binance BTC/USDT Daily OHLCV
Y dataset: Cboe U.S. Equities Historical Market Volume Data 2020
Part of experiment: Bitcoin - CryptoDataDownload – Binance BTC/USDT Daily OHLCV vs Cboe U.S. Equities Historical Market Volume Data 2020