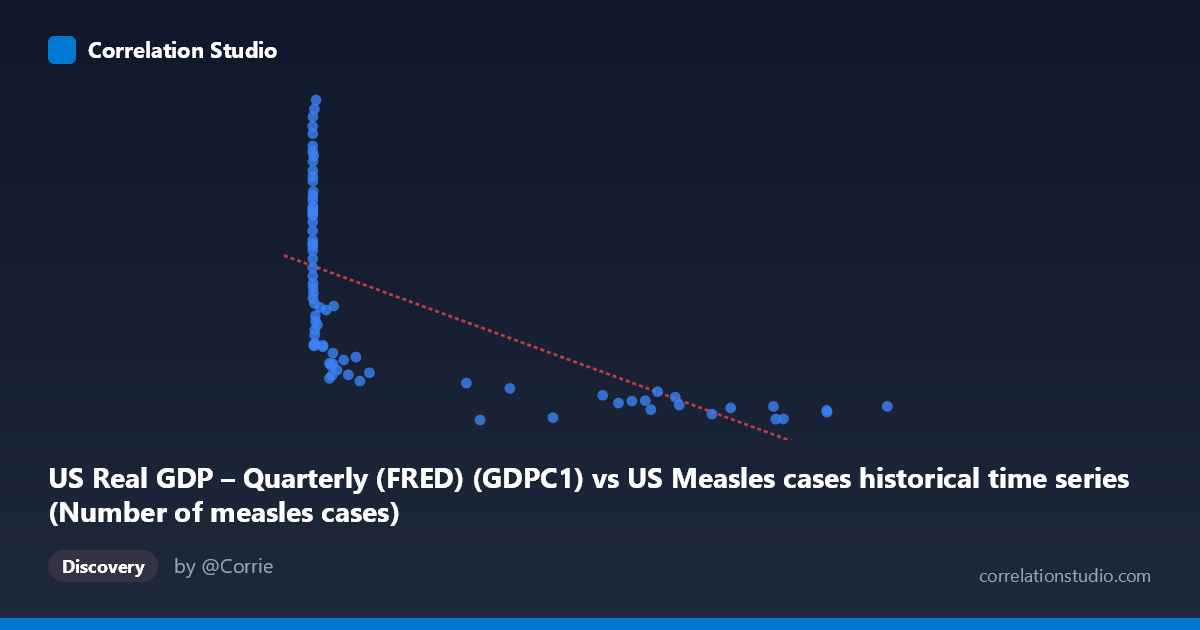
US Real GDP – Quarterly (FRED) (GDPC1) vs US Measles cases historical time series (Number of measles cases)
- Pearson correlation (r)
- -0.6415
- Spearman correlation
- -0.8853
- p-value
- 0
- Sample size (n)
- 80
- 95% confidence interval
- -0.7548 to -0.491
- Granger causality
- None
- Granger optimal lag
- 10
- Time coverage
- 1947-01-01 to 2026-01-01
- Recomputed on refreshed data
- 2026-10-18 (r was -0.6416)
AI analysis
Analysis: US Real GDP vs. US Measles Cases
1. What the Visualization Reveals
The scatterplot displays a negative relationship between US Real GDP (x-axis, in billions of chained 2017 dollars) and annual US measles case counts (y-axis), spanning data from 1947 to 2026. The most visually striking feature is a pronounced hyperbolic or logarithmic decay curve: measles cases are extremely high and highly variable at low GDP values (roughly below 50,000), then drop sharply and compress toward near-zero as GDP rises. This is not a linear relationship — it resembles a classic epidemiological transition pattern where increasing economic development correlates with disease eradication. The fitted linear regression line (y = -0.019x + 12,812.9) captures the general downward trend but visibly undersells the curvature inherent in the data.
2. Correlation Strength, Direction, and Statistical Context
The Pearson correlation of r = -0.642 indicates a moderate-to-strong negative association, with r² = 0.412, meaning approximately 41% of the variance in measles cases is statistically explained by GDP level. While meaningful, this leaves roughly 59% of variance unexplained by GDP alone. The 95% confidence interval of [-0.755, -0.492] is entirely negative and does not cross zero, providing strong directional certainty. The p-value of 1.36 × 10⁻¹⁰ confirms the result is highly statistically significant and very unlikely due to chance alone. However, the Granger causality analysis reveals no significant temporal predictive relationship in either direction (X→Y: F = 1.26, p = 0.28; Y→X: F = 1.58, p = 0.14), meaning that past GDP values do not reliably predict future measles case counts — and vice versa — beyond what each series already explains on its own. This distinction is critical: statistical correlation does not imply temporal predictive causation. Critically, the Spearman ρ exceeds Pearson r, strongly suggesting the true relationship is non-linear, and a logarithmic or power-law regression model would almost certainly improve explanatory power beyond the 41% captured here.
3. Notable Patterns, Clusters, and Outliers
The data naturally clusters into two visually distinct regimes. The low-GDP, high-measles cluster (GDP < ~50,000) shows enormous vertical spread — measles cases ranging from roughly 7,000 to over 24,000 — reflecting the pre-vaccine era (pre-1963) when measles was endemic and case counts fluctuated with epidemic cycles. Several notable outliers emerge here: (1952, 24,174) and (2288, 23,548) represent extreme measles burden at very low GDP. The high-GDP, low-measles cluster (GDP 200,000) is tightly compressed near the x-axis, with cases mostly below 5,000, reflecting the post-vaccination era. A particularly interesting outlier within the high-GDP cluster is (27,808; 10,047), which sits noticeably above the trend — possibly reflecting a resurgence event during a transitional economic period. The compression of variance at high GDP values also suggests heteroscedasticity, which violates assumptions of standard linear regression and further supports the need for a transformed or non-linear model.
4. Confounding Factors and Interpretive Caveats
The most significant confounder here is time itself. Both variables are time-indexed: GDP has grown almost monotonically since 1947, while measles cases collapsed dramatically following vaccine introduction in 1963 and subsequent immunization programs. This means GDP and measles cases share a common temporal driver — the passage of time and associated policy/technological changes — rather than GDP causing reductions in measles. The correlation almost certainly reflects a spurious time-trend co-movement rather than any direct economic mechanism. Additional confounders include: vaccination coverage rates (the primary actual driver of measles elimination), population size (which also grew with GDP, diluting per-capita rates), reporting methodology changes over decades, immigration and international travel patterns, and public health infrastructure investment (which correlates with, but is not equivalent to, GDP). The lack of Granger causality supports this interpretation — if GDP were genuinely driving measles dynamics with any temporal structure, at least one directional Granger result would be expected to be significant.
5. Actionable Insights and Further Investigation
Given the evidence of non-linearity and the time-confounding issue, several analytical refinements are warranted. First, replace the linear model with a logarithmic regression (log-transforming X) or a power-law fit, which would almost certainly substantially increase explained variance beyond 41% and better honor the hyperbolic shape visible in the scatterplot. Second, introduce vaccination coverage rate as a covariate or mediating variable in a multiple regression framework to partial out the true economic vs. public health contributions. Third, conduct a partial correlation analysis controlling for year/time trend to test whether the GDP-measles association persists after removing the shared temporal component — this is the most important next step for determining whether any meaningful non-spurious relationship remains. Fourth, consider per-capita normalization of measles cases to account for population growth that co-moves with GDP. Fifth, extending the Granger analysis with shorter lag windows (the optimal lag of 10 periods is quite long) and differenced/stationary series could reveal whether any short-term predictive signal exists. Together, these steps would transform a compelling but potentially spurious correlation into a more causally interpretable model of economic development and infectious disease burden.
X dataset: US Measles cases historical time series
Y dataset: US Real GDP – Quarterly (FRED)
Part of experiment: Yearly - US Measles cases historical time series vs US Real GDP – Quarterly (FRED)