S&P 500 Daily Time Series since 1927 (GitHub fja05680) (Date) (Volume) vs Cboe U.S. Equities Historical Market Volume Data 2013 (Tape A Trade Count)
- Pearson correlation (r)
- 0.8705
- Spearman correlation
- 0.8891
- p-value
- 0
- Sample size (n)
- 252
- 95% confidence interval
- 0.837 to 0.8976
- Granger causality
- None
- Granger optimal lag
- 10
AI analysis
Analysis: S&P 500 Trading Volume vs. Cboe Tape A Trade Count (2013)
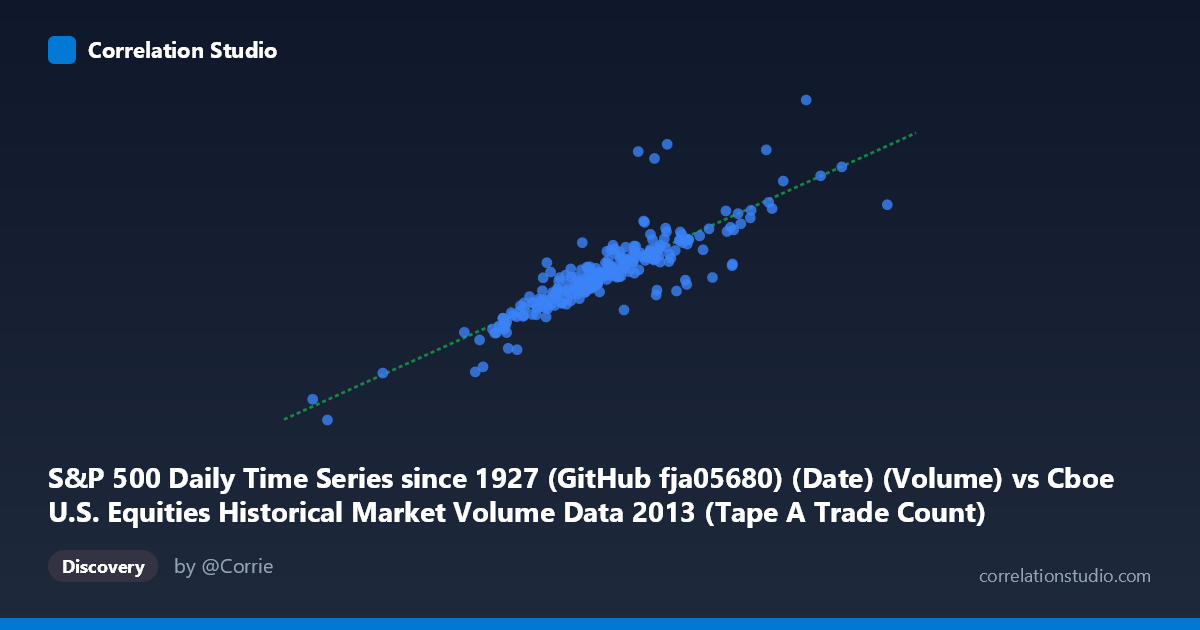
Relationship Overview The scatterplot reveals a strong positive linear relationship between S&P 500 daily trading volume and Cboe U.S. Equities Tape A trade count across 252 trading days in 2013. As daily volume increases along the X-axis (ranging from roughly 411K to 1.44M), the Tape A trade count rises correspondingly along the Y-axis (spanning approximately 1.31B to 5.80B). The linear regression equation (y = 3556.1x + 3.42×10⁷) fits the data reasonably well, with points clustering relatively tightly around the regression line through the central mass of the distribution, though with increasing spread at higher volume levels.
Correlation Strength and Statistical Significance The Pearson correlation of r = 0.8705 indicates a strong positive association, and the R² of 0.7578 means that roughly 75.8% of the day-to-day variance in Tape A trade count is statistically explained by variation in S&P 500 volume — a substantial but not complete explanatory relationship. The remaining ~24% reflects influences not captured by volume alone. The 95% confidence interval of [0.837, 0.898] is notably narrow, reflecting the large sample base (N = 3,780 underlying observations, n = 252 paired daily points), and the p-value of essentially zero confirms this correlation is not a chance artifact. However, the Granger causality results are telling: neither direction (X→Y: F = 1.32, p = 0.22; Y→X: F = 0.85, p = 0.58) reaches significance even at a 10-lag optimal window. This means that while the two variables move together strongly in level, neither reliably predicts future changes in the other — they appear to be contemporaneously correlated co-movements rather than causally linked in temporal sequence.
Patterns, Clusters, and Outliers The data shows a clear central cluster between approximately 850K–1,100K on the X-axis and 3.0B–3.9B on the Y-axis, representing typical 2013 trading conditions. A notable lower-left outlier cluster exists around X ≈ 536K–760K (e.g., the point at ~537K, 1.97B), likely corresponding to holiday-shortened sessions or anomalously quiet summer/year-end trading days when both volume and trade counts collapse simultaneously. At the upper end, a handful of high-volume days (X 1.2M) show elevated scatter — for instance, points near (1,253K, 4.66B) and (1,233K, 4.27B) — suggesting that on high-activity days, the volume-to-trade-count relationship becomes more variable, possibly reflecting differences in average trade size during volatile or event-driven sessions.
Confounding Factors and Caveats Several important caveats apply. First, both variables fundamentally measure market activity, so much of the correlation may be tautological — days with more trading naturally produce both higher volume and more trades. This shared underlying driver (overall market participation) inflates the apparent explanatory power. Second, average trade size acts as a potential confound: if algorithmic activity shifts intraday, volume could rise without proportional increases in trade count (or vice versa), explaining the residual variance. Third, the dataset covers only calendar year 2013, a single relatively calm bull-market year, so the relationship may not generalize to higher-volatility regimes (e.g., 2008, 2020) where volume surges but trade fragmentation patterns differ. Finally, the axis label crossover (S&P 500 volume on X, Cboe Tape A count on Y, drawn from each other's datasets) warrants careful verification that the join is temporally aligned without date-matching errors.
Actionable Insights and Further Investigation Given the strong contemporaneous correlation but absent Granger predictability, practitioners should not use one series to forecast the other in a trading strategy without additional signals. Instead, the ratio of trade count to volume (i.e., implied average trade size) deserves investigation as a standalone indicator — deviations from the regression line could flag unusual institutional block trading or algorithmic fragmentation events worth monitoring. Further analysis should extend the time window across multiple market regimes (2008–2023) to test whether this r² of 0.76 holds or degrades during stress periods. Segmenting by day-of-week or proximity to FOMC announcements could also reveal whether the outlier low-volume days cluster around specific calendar events, offering a more nuanced picture of when volume and trade count decouple.
X dataset: Cboe U.S. Equities Historical Market Volume Data 2013
Y dataset: S&P 500 Daily Time Series since 1927 (GitHub fja05680) (Date)
Part of experiment: Daily - Cboe U.S. Equities Historical Market Volume Data 2013 vs S&P 500 Daily Time Series since 1927 (GitHub fja05680) (Date)