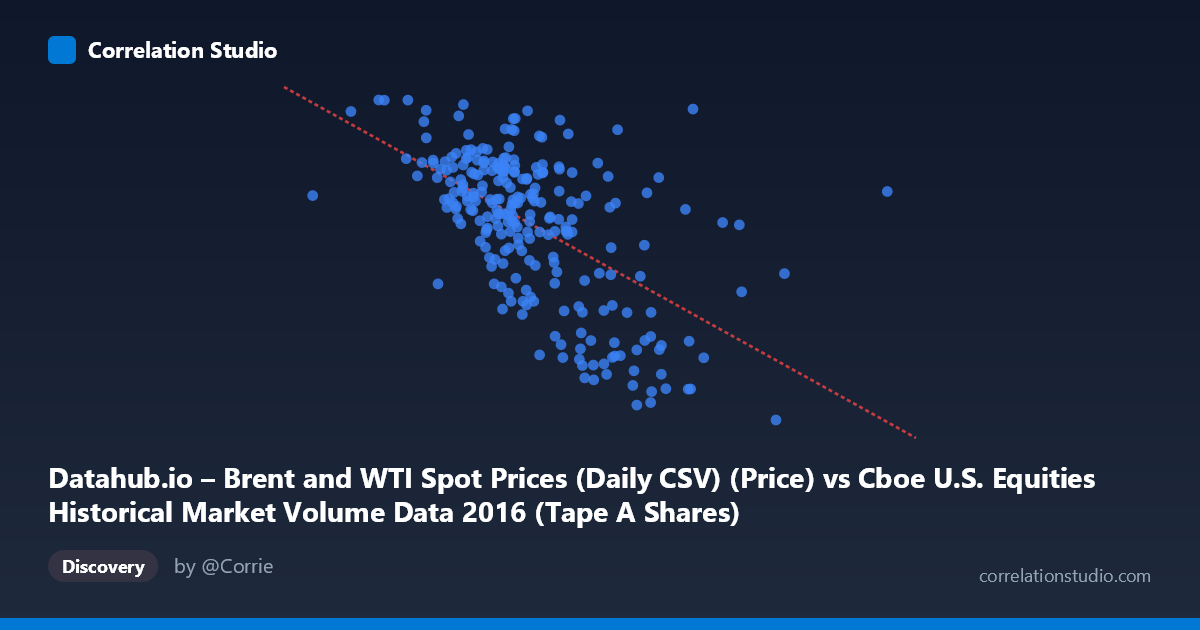
Datahub.io – Brent and WTI Spot Prices (Daily CSV) (Price) vs Cboe U.S. Equities Historical Market Volume Data 2016 (Tape A Shares)
- Pearson correlation (r)
- -0.5768
- Spearman correlation
- -0.5678
- p-value
- 0
- Sample size (n)
- 251
- 95% confidence interval
- -0.654 to -0.4879
- Granger causality
- None
- Granger optimal lag
- 1
AI analysis
Analysis: Brent Oil Prices vs. U.S. Equity Market Volume (2016)
Relationship Overview The scatterplot reveals a moderate negative relationship between U.S. equity market trading volume (X-axis, measured in shares) and Brent crude oil spot prices (Y-axis, measured in USD per barrel) across 251 trading days in 2016. The linear regression equation (y = -6.60e-08x + 61.68) indicates that as daily equity market volume increases, Brent oil prices tend to decline. This inverse pattern is visually apparent in the chart, with higher-volume trading days clustering at lower price levels and lower-volume days associating with higher oil prices. The relationship is interpretable through a shared macroeconomic lens: periods of market stress or uncertainty tend to drive both elevated trading volumes and suppressed commodity prices simultaneously.
Correlation Strength and Statistical Significance The Pearson correlation of r = -0.577 reflects a moderate negative association, with r² = 0.333 indicating that roughly 33% of the variance in Brent prices is explained by equity market volume — meaningful, but leaving two-thirds of variability unexplained by this variable alone. The 95% confidence interval of [-0.654, -0.488] is relatively tight and does not cross zero, and the p-value is effectively zero, confirming that this relationship is highly unlikely to be a statistical artifact given n = 251 paired observations drawn from a population of N = 3,622. However, the Granger causality results tell a more cautionary tale: neither variable significantly predicts the other temporally (X→Y: F = 0.184, p = 0.668; Y→X: F = 0.494, p = 0.483). This is critical — while the contemporaneous correlation is robust, there is no evidence that changes in equity volume lead changes in oil prices (or vice versa), suggesting both are likely driven by common underlying forces rather than one causing the other.
Notable Patterns, Clusters, and Outliers Several structural features warrant attention. The data exhibits a somewhat funnel or heteroscedastic shape: at mid-range volumes (~220–280 million shares), oil prices span a wide range (roughly 37–54 USD/barrel), while at the extremes of volume the price range narrows. A visible cluster of high-volume, low-price observations appears in the upper-right and lower-right of the chart, anchored by at least one prominent outlier near (458M shares, $26/barrel) — consistent with the early 2016 oil price trough when Brent briefly fell below $30. Conversely, lower-volume days (below ~220M shares) tend to cluster at higher price levels (~47–54 USD/barrel), consistent with calmer, late-2016 market conditions as oil recovered. The point at approximately (363M shares, $27.59) is another notable outlier, suggesting a specific episode of high-stress market activity coinciding with depressed oil prices.
Confounding Factors and Caveats Several confounds complicate causal interpretation. 2016 was an exceptional year for oil markets, characterized by the OPEC production freeze negotiations, a multi-year price bottom in January/February, and a sharp recovery by year-end — creating a strong temporal trend in oil prices independent of equity volumes. Equity volume itself is influenced by volatility regimes, algorithmic trading patterns, index rebalancing events, and macroeconomic announcements, none of which are captured here. The axes appear to be mislabeled or swapped based on the dataset descriptions (equity volume is on X, oil price on Y, yet dataset attribution is reversed in the notes) — this should be verified before publication. Additionally, both series share exposure to global risk sentiment (e.g., Brexit vote in June 2016, U.S. election in November), which could manufacture spurious correlation through a common driver rather than any direct link.
Actionable Insights and Further Investigation Given the moderate correlation and absent Granger causality, this relationship is best treated as a coincident indicator rather than a predictive one — neither variable reliably leads the other. Analysts should consider controlling for VIX or implied volatility to determine whether market fear explains both elevated volume and suppressed oil prices simultaneously. Segmenting the data by quarter or market regime (pre/post OPEC agreement) would test whether the correlation is stable or concentrated in specific stress periods. Including additional commodities (WTI, gold) or macroeconomic variables (USD index, 10-year yields) in a multivariate regression could substantially improve explanatory power beyond the current 33%. Finally, examining sector-specific equity volumes (energy stocks in particular) rather than aggregate market volume might reveal a more mechanistically coherent and actionable relationship.
X dataset: Cboe U.S. Equities Historical Market Volume Data 2016
Y dataset: Datahub.io – Brent and WTI Spot Prices (Daily CSV)
Part of experiment: Daily - Cboe U.S. Equities Historical Market Volume Data 2016 vs Datahub.io – Brent and WTI Spot Prices (Daily CSV)