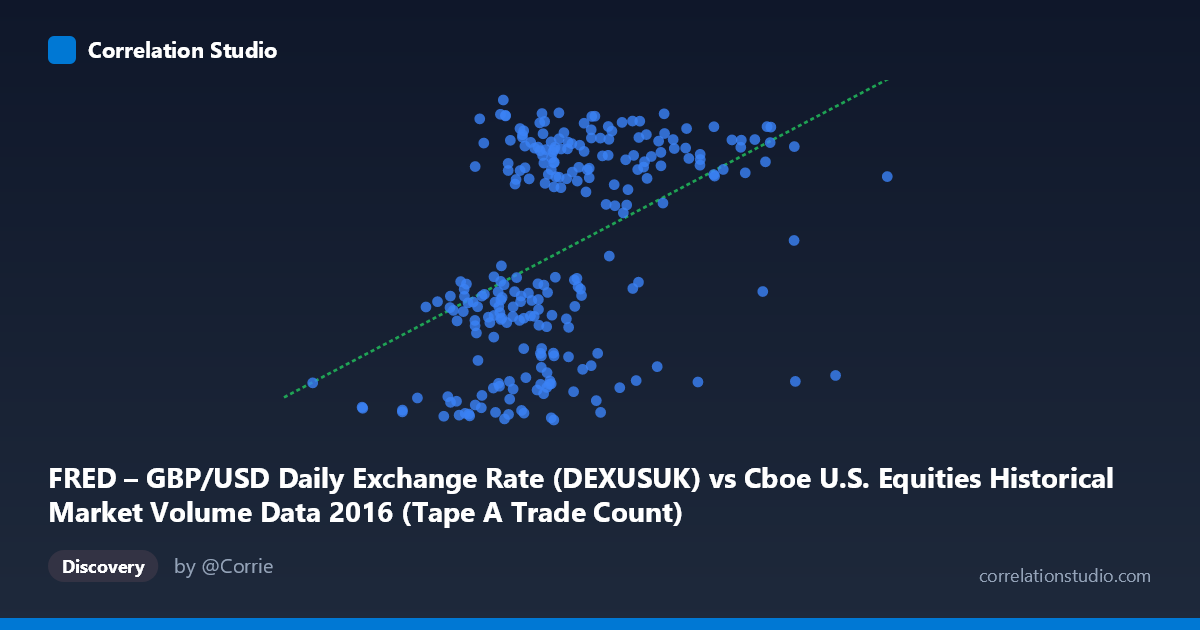
FRED – GBP/USD Daily Exchange Rate (DEXUSUK) vs Cboe U.S. Equities Historical Market Volume Data 2016 (Tape A Trade Count)
- Pearson correlation (r)
- 0.4487
- Spearman correlation
- 0.4671
- p-value
- 0
- Sample size (n)
- 250
- 95% confidence interval
- 0.3438 to 0.5426
- Granger causality
- None
- Granger optimal lag
- 1
AI analysis
Analysis: GBP/USD Exchange Rate vs. Cboe Equity Trade Count (2016)
Relationship Overview The scatterplot reveals a modest positive relationship between Cboe U.S. equity market trade counts (X-axis) and the GBP/USD daily exchange rate (Y-axis) across 2016. The linear regression equation (y = 1.2792E-07x + 1.17759) indicates that as daily equity trade volume increases, the pound sterling tends to trade at a slightly higher value against the dollar. Visually, the data points likely show a gentle upward trend obscured by considerable scatter, with the Y-values clustered in a relatively narrow band between approximately 1.22 and 1.48 USD per GBP, while X-values span a wide range from roughly 540,000 to nearly 2.5 million trades.
Correlation Strength and Statistical Significance The Pearson correlation of r = 0.449 indicates a weak-to-moderate positive association. More critically, r² = 0.201 means that only 20.1% of the variance in GBP/USD is explained by equity trade count, leaving nearly 80% attributable to other factors entirely. The 95% confidence interval of [0.344, 0.543] confirms the effect is real and non-trivial in magnitude, and the p-value of 8.68E-14 establishes overwhelming statistical significance given n = 250 paired observations from a population of 3,622 trading days — effectively ruling out chance as an explanation. However, the Granger causality results decisively undercut any causal narrative: neither direction (X→Y: F = 0.065, p = 0.799; Y→X: F = 0.724, p = 0.396) achieves significance at even a lenient threshold, meaning neither variable temporally predicts the other at a one-period lag. This is a correlation without detectable directional forecasting power.
Notable Patterns and Outliers Several features deserve attention in the sample points. The extreme lower-left of the Y range (values of 1.22–1.23 GBP/USD) appears at multiple X values across a wide range of trade counts, suggesting these low exchange rate readings are not isolated incidents but rather a distinct cluster — likely reflecting the post-Brexit referendum shock in late June 2016, when sterling collapsed sharply. There are also apparent high-volume outliers on the X-axis (e.g., the point near 2,184,215 and 2,321,280 trades) that correspond to relatively low GBP/USD values (~1.25), which may represent volatility-driven volume spikes. The overall spread suggests heteroscedasticity, with Y variance potentially wider at lower X values.
Confounding Factors and Caveats The most significant confounding factor is the Brexit referendum on June 23, 2016, which simultaneously caused a historic collapse in GBP/USD and likely triggered abnormally high equity trading volumes due to market shock — creating a spurious correlation driven by a single exogenous event rather than any structural economic relationship. Both variables are time-indexed daily series in 2016, making them vulnerable to shared temporal trends and regime changes rather than genuine co-movement. The narrow Y-range (just 26 basis points wide) amplifies the apparent sensitivity of the regression slope. Additionally, equity trade counts reflect U.S. domestic market activity, while GBP/USD is driven primarily by UK monetary policy, inflation differentials, and geopolitical sentiment — domains with little mechanistic overlap.
Actionable Insights and Further Investigation Given the absence of Granger causality, practitioners should not use equity trade volume as a predictive signal for GBP/USD or vice versa in any trading or risk model. Further investigation should isolate the Brexit period (pre- vs. post-June 23) as separate regimes to test whether the correlation is entirely driven by that single event — if the correlation disappears when that cluster is removed, the relationship is spurious by construction. It would also be valuable to test longer lag structures in the Granger framework (beyond one period) and to introduce control variables such as VIX, U.S. economic surprises, or Bank of England policy announcements. Exploring whether other currency pairs (e.g., EUR/USD) show similar correlations with trade volume would help determine if this reflects a broad dollar-strength effect rather than anything GBP-specific.
X dataset: Cboe U.S. Equities Historical Market Volume Data 2016
Y dataset: FRED – GBP/USD Daily Exchange Rate
Part of experiment: Daily - Cboe U.S. Equities Historical Market Volume Data 2016 vs FRED – GBP/USD Daily Exchange Rate