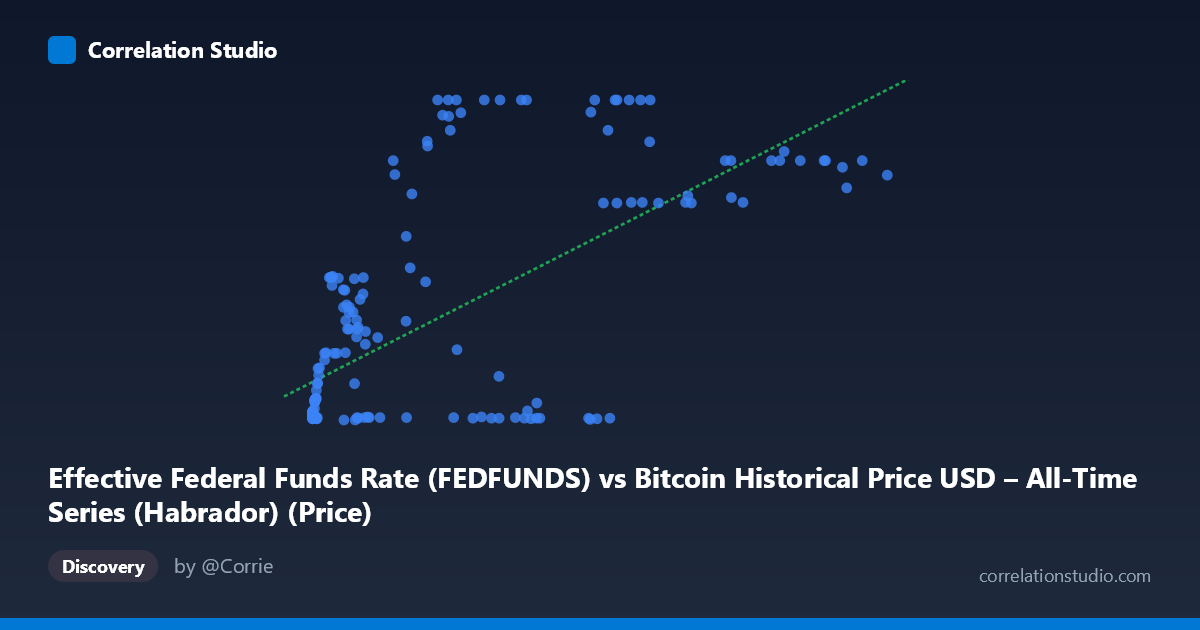
Effective Federal Funds Rate (FEDFUNDS) vs Bitcoin Historical Price USD – All-Time Series (Habrador) (Price)
- Pearson correlation (r)
- 0.6739
- Spearman correlation
- 0.5459
- p-value
- 0
- Sample size (n)
- 194
- 95% confidence interval
- 0.5889 to 0.7441
- Granger causality
- Y → X
- Granger optimal lag
- 1
- Time coverage
- 2010-08-01 to 2026-09-01
- Recomputed on refreshed data
- 2026-10-24 (r was 0.66)
AI analysis
Analysis: Bitcoin Price vs. Effective Federal Funds Rate
1. What the Visualization Reveals
The scatterplot plots Bitcoin's historical USD price (X-axis, despite the confusing label swap, functions here as the independent variable) against the Effective Federal Funds Rate (Y-axis). The data shows a clear positive but non-linear relationship: at low Bitcoin prices (under ~$1,000), the Fed Funds Rate clusters tightly near zero (0.05–0.20), reflecting the near-zero interest rate policy of the 2010s. As Bitcoin's price climbs into the tens of thousands, the Fed Funds Rate values become highly variable — ranging from near 0 to over 5%, with many points clustering around 4.0–5.3%. This pattern strongly suggests the relationship is driven by time, not a direct causal or mechanical link between the two variables.
2. Strength, Direction, and Uncertainty
The correlation coefficient (r = 0.66, R² = 0.436) indicates a moderate positive relationship, with about 44% of the variance in the Fed Funds Rate "explained" by Bitcoin's price in a simple linear sense. The 95% CI [0.571, 0.734] is reasonably tight and excludes zero, and the p-value of ~0 confirms this correlation is highly statistically significant — it did not arise by chance in this sample. However, statistical significance here should not be conflated with practical or causal significance, especially given that both series are non-stationary time trends. The Granger causality results add an important nuance: the test suggests Y (Fed Funds Rate) Granger-causes X (Bitcoin price) — not the reverse — with F=4.52, p=0.035, while Bitcoin price shows no significant predictive power over the Fed Funds Rate (p=0.51). This implies that changes in interest rate regime may historically precede/help predict Bitcoin price movements, consistent with macro narratives about liquidity conditions influencing risk-asset prices, rather than Bitcoin driving monetary policy (which would be economically implausible anyway).
3. Notable Patterns and Outliers
The chart reveals distinct regime clusters rather than a smooth continuous relationship: - A large cluster at low X, low Y (early Bitcoin, ZIRP era ~2011–2015) - A cluster at moderate-to-high X (~$20,000–60,000) with Y values spanning both near-zero (~0.07–0.20) and elevated (~4.3–5.3) — this is the most telling feature, showing the same Bitcoin price levels coinciding with wildly different interest rate regimes depending on the time period (e.g., 2020–21 near-zero rates vs. 2023–24 tightening cycle) - Points like (57,454, 5.13) and (62,440, 5.33) show Bitcoin sustaining high prices even as rates hit multi-decade highs, contradicting a simple "higher rates suppress Bitcoin" narrative - The relationship appears more like two or three separate linear segments (a "step function" or regime-switching pattern) rather than a single continuous trend, which linear regression (R²=0.436) only partially captures
4. Confounding Factors and Caveats
The most significant caveat is that both variables are trending time series confounded by a shared underlying driver: calendar time. Bitcoin price has grown roughly exponentially over its history, while the Fed Funds Rate has moved through distinct policy regimes (ZIRP 2009–2015, gradual hikes 2016–2019, ZIRP again 2020–2022, aggressive hikes 2022–2023). Any two trending series sampled over the same period can show spurious correlation without genuine mechanistic linkage. This is a classic case where correlation analysis on non-stationary data can be misleading — a more rigorous approach would detrend both series or use returns/differences rather than levels. Additionally, N=862 total population vs. n=189 sampled suggests substantial subsampling, and monthly Fed rate data paired with more granular Bitcoin price data introduces temporal aggregation mismatches.
5. Actionable Insights
For further investigation: (1) re-run the analysis on differenced or log-return series rather than raw levels to test whether the relationship survives detrending; (2) segment the analysis by distinct monetary policy regimes (ZIRP vs. hiking cycles) to test whether the relationship is stable or regime-dependent; (3) given the Granger result, explore lagged regression models (Fed rate at t-1 predicting Bitcoin price at t) with additional macro controls (inflation, DXY, equity indices) to isolate whether this is a genuine liquidity-driven effect or a proxy for broader risk-on/risk-off sentiment; (4) treat the current linear R² of 0.436 as an upper-bound artifact of trending data rather than a reliable estimate of true explanatory power.
X dataset: Bitcoin Historical Price USD – All-Time Series (Habrador)
Y dataset: Effective Federal Funds Rate
Part of experiment: Bitcoin - Bitcoin Historical Price USD – All-Time Series (Habrador) vs Effective Federal Funds Rate