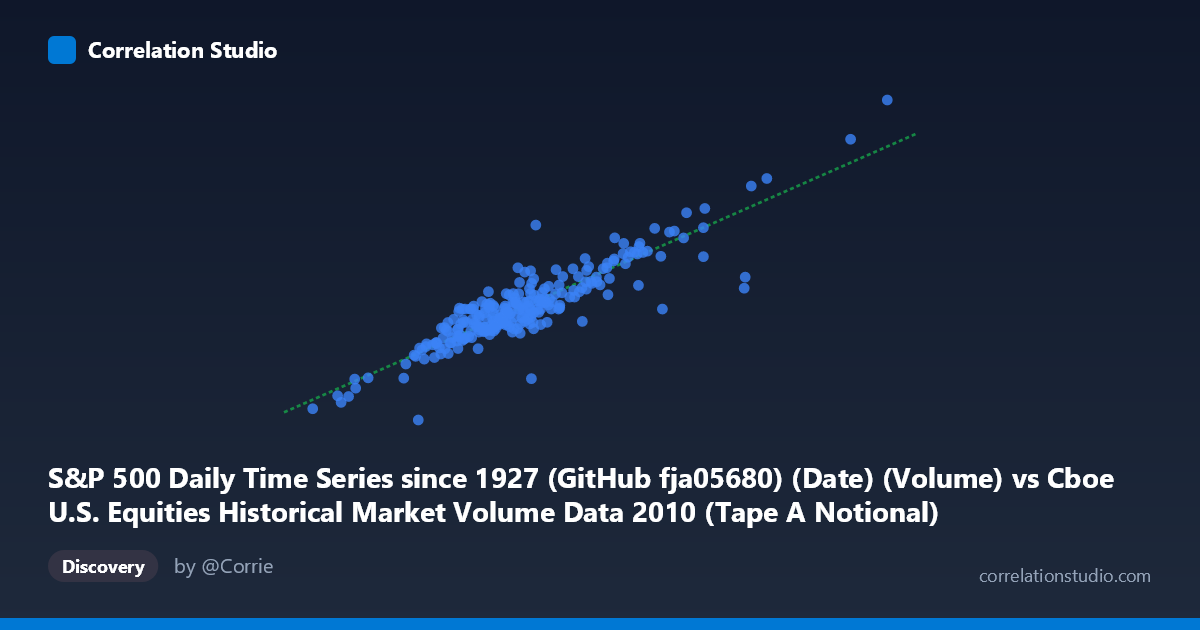
S&P 500 Daily Time Series since 1927 (GitHub fja05680) (Date) (Volume) vs Cboe U.S. Equities Historical Market Volume Data 2010 (Tape A Notional)
- Pearson correlation (r)
- 0.899
- Spearman correlation
- 0.8548
- p-value
- 0
- Sample size (n)
- 252
- 95% confidence interval
- 0.8723 to 0.9203
- Granger causality
- None
- Granger optimal lag
- 10
AI analysis
Scatterplot Analysis: S&P 500 Trading Volume vs. Cboe Tape A Notional Value (2010)
Relationship Overview
The scatterplot reveals a strong, positive linear relationship between S&P 500 daily trading volume and Cboe Tape A notional value across 252 trading days in 2010. As daily share volume increases, the corresponding notional dollar value of trades on Tape A (NYSE-listed securities) rises proportionally. The linear regression equation y = 0.4265x + 6.969×10⁸ describes this well, with the slope indicating that each additional share traded corresponds to roughly $0.43 in Tape A notional value — a sensible relationship given that notional value is fundamentally the product of volume and price. The data cloud is elongated along a clear diagonal axis, confirming the dominant linear trend throughout the year.
Correlation Strength and Statistical Significance
The correlation is r = 0.8990, indicating a very strong positive association, and the coefficient of determination r² = 0.8082 means that approximately 80.8% of the variance in Tape A notional value is explained by total trading volume. The remaining ~19% reflects variation attributable to price-level fluctuations, market composition shifts, and other unmeasured factors. The 95% confidence interval of [0.8723, 0.9203] is notably tight, reflecting high precision in this estimate, and the p-value of effectively 0 confirms that the result is overwhelmingly statistically significant — the probability of observing this correlation by chance is negligible. However, the Granger causality tests reveal no significant predictive temporal relationship in either direction (X→Y: F=1.197, p=0.294; Y→X: F=1.515, p=0.135), meaning that past volume does not reliably predict future notional value and vice versa at a 10-period lag. This is a critical nuance: the variables move together contemporaneously but neither reliably leads the other, suggesting they are jointly driven by common underlying market forces rather than one causing the other.
Notable Patterns, Clusters, and Outliers
The data exhibits a relatively tight linear band through the middle range of observations, but the distribution is not entirely uniform. Several notable features stand out:
- A cluster of high-volume, high-notional days in the upper right (X ~15×10⁹, Y ~7×10⁹) appears sparser and somewhat elevated above the regression line, suggesting that extreme-volume days carry disproportionately higher notional values — possibly reflecting large-cap, high-price stock activity dominating on those sessions - One conspicuous low outlier near X ≈ 5.95×10⁹, Y ≈ 1.29×10⁹ sits dramatically below the regression line — the minimum Y value of ~$1.29B against what would be a predicted value of roughly $3.2B, implying an anomalous day where volume occurred but notional value was suppressed, possibly a holiday-shortened or data anomaly session - A dense central cluster between X = 7–11×10⁹ and Y = 3.5–5.5×10⁹ represents typical 2010 trading days, where the linear fit is most reliable - The upper-right point near X ≈ 18.97×10⁹, Y ≈ 9.47×10⁹ is a clear leverage point that, while on-trend, reflects an extreme-volume event (likely an index rebalancing or macro shock day)
Confounding Factors and Interpretive Caveats
Several important caveats temper this analysis. First, notional value is mathematically coupled to volume (notional = shares × price), so much of the explained variance may reflect this definitional relationship rather than any economically independent dynamic. Second, intraday price level changes throughout 2010 — the S&P 500 ranged from ~1,022 to ~1,259 — mean that identical share volumes on different days yield different notional values, contributing to residual variance. Third, the Granger causality null result at 10 lags should be interpreted carefully: the optimal lag was selected algorithmically and may not capture shorter or longer meaningful predictive horizons. Fourth, dataset alignment deserves scrutiny — X is labeled as a "Date (Volume)" column from the S&P 500 GitHub dataset while Y draws from Cboe's own dataset, raising the possibility of subtle definitional mismatches in how "volume" is counted across sources. Finally, the population size of 3,302 vs. sample of 252 warrants attention — if the broader population spans multiple years, the 2010-specific sample may not generalize.
Actionable Insights and Further Investigation
For practitioners and researchers, this analysis suggests several follow-on steps. Investigate the low outlier (~$1.29B notional) specifically — identifying the date could reveal whether it represents a data error, holiday session, or genuine market anomaly requiring exclusion or special treatment. Decompose the unexplained 19% variance by incorporating price-level controls (e.g., daily S&P 500 closing price or VIX as a proxy for volatility-driven notional inflation) into a multivariate regression. Re-test Granger causality at shorter lags (1–5 periods) given that intraday momentum in equity markets typically dissipates within days, not 10 trading periods. Extend the analysis across multiple years to determine whether the r² of ~0.81 is stable across different market regimes (e.g., 2008 crisis, 2020 COVID shock) or whether the volume-notional relationship degrades in stressed environments where price dislocations dominate. Finally, segment by market cap tier or sector within Tape A to determine whether the relationship is driven primarily by large-cap names, which would have significant implications for market microstructure research.
X dataset: Cboe U.S. Equities Historical Market Volume Data 2010
Y dataset: S&P 500 Daily Time Series since 1927 (GitHub fja05680) (Date)
Part of experiment: Daily - Cboe U.S. Equities Historical Market Volume Data 2010 vs S&P 500 Daily Time Series since 1927 (GitHub fja05680) (Date)