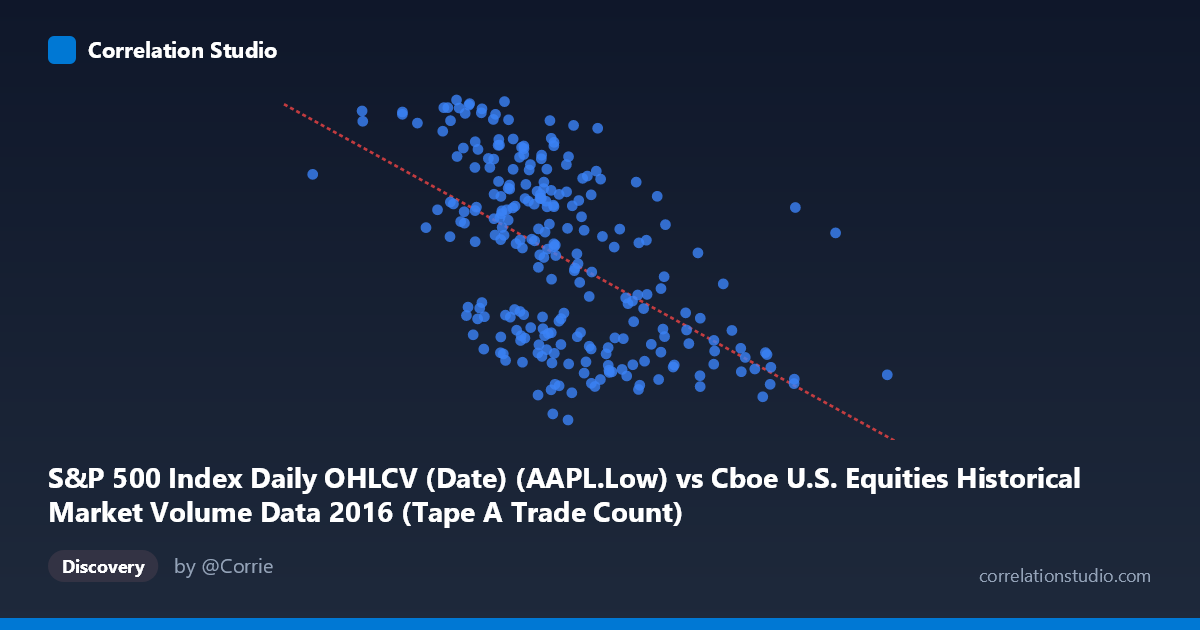
S&P 500 Index Daily OHLCV (Date) (AAPL.Low) vs Cboe U.S. Equities Historical Market Volume Data 2016 (Tape A Trade Count)
- Pearson correlation (r)
- -0.5476
- Spearman correlation
- -0.5688
- p-value
- 0
- Sample size (n)
- 252
- 95% confidence interval
- -0.6286 to -0.4548
- Granger causality
- None
- Granger optimal lag
- 1
AI analysis
Analysis of AAPL Low Price vs. Cboe Tape A Trade Count (2016)
Relationship Overview The scatterplot reveals a moderate negative relationship between Apple's daily low price (X-axis) and the Cboe U.S. Equities Tape A trade count (Y-axis) across 2016 trading days. As AAPL's low price increases, the number of trades on Tape A tends to decrease. This inverse pattern is visually apparent in the downward slope of the regression line (y = -1.41493E-05x + 123.342), though considerable scatter exists around that trend. The relationship spans a meaningful range — AAPL low prices from roughly $540 to $2,497 (likely adjusted or split-related values) and trade counts between approximately 89 and 117 (likely in millions or thousands of units).
Correlation Strength and Statistical Significance The Pearson correlation of r = -0.5476 indicates a moderate negative association, and the R² of 0.2998 means that roughly 30% of the variance in Tape A trade counts is explained by AAPL's low price alone — meaningful, but leaving 70% attributable to other factors. The 95% confidence interval of [-0.6286, -0.4548] is notably tight and does not cross zero, and the p-value of essentially 0 confirms this correlation is highly statistically significant across the 252 paired observations. However, the Granger causality results are unambiguous in their null finding: neither direction (X→Y: F=0.687, p=0.408; Y→X: F=1.703, p=0.193) reaches significance at conventional thresholds. This means that despite the meaningful contemporaneous correlation, AAPL's low price does not temporally predict trade counts, nor do trade counts predict AAPL's low price with a one-period lag — a critical distinction between correlation and predictive causation.
Patterns, Clusters, and Outliers The sample points reveal notable heterogeneity. Several observations cluster around AAPL low prices of 1.1M–1.4M with trade counts ranging widely from ~90 to ~115, suggesting high variability in market activity even at similar price levels. A few points stand out as potential outliers: (1409909.64, 89.47) represents an unusually low trade count, while (1000524.00, 116.78) and (1176505.13, 113.51) show high trade activity at relatively lower price levels, consistent with the negative trend. The spread appears to widen at lower X values, hinting at possible heteroscedasticity — trade count variance may be larger when AAPL prices are lower, which could slightly inflate or distort the linear fit.
Confounding Factors and Caveats Several important caveats temper interpretation. First, both variables are time-series measured over the same 2016 calendar year, making them susceptible to shared macro-driven trends — early 2016 saw broad market volatility and lower equity prices coinciding with elevated trading volumes, which could artificially generate this correlation without a direct causal mechanism. Second, the dataset note mismatch (AAPL price data sourced from "Cboe" and Tape A counts from "S&P 500 OHLCV") suggests potential dataset labeling or join errors that warrant verification. Third, Tape A encompasses all NYSE-listed securities, not just AAPL, so the correlation may reflect market-wide dynamics (e.g., volatility regimes driving both price suppression and volume surges) rather than any AAPL-specific effect. The absence of Granger causality with only a lag-1 test is also a limited assessment.
Actionable Insights and Further Investigation Given the 30% explained variance and the failure of Granger causality tests, practitioners should treat this correlation as contextually interesting but not operationally predictive in isolation. Recommended next steps include: (1) extending Granger causality testing to lags 2–10 to rule out longer feedback loops; (2) controlling for the VIX or market-wide volatility indices, which likely confound both variables simultaneously; (3) segmenting the data by market regime (e.g., Q1 2016 selloff vs. Q4 recovery) to test whether the correlation is stable or driven by specific periods; and (4) verifying the dataset join logic to ensure X and Y values are correctly paired by date. A multivariate regression incorporating volatility, market breadth, and day-of-week effects would likely absorb much of the unexplained 70% variance and clarify whether AAPL pricing retains any independent explanatory power.
X dataset: Cboe U.S. Equities Historical Market Volume Data 2016
Y dataset: S&P 500 Index Daily OHLCV (Date)
Part of experiment: Daily - Cboe U.S. Equities Historical Market Volume Data 2016 vs S&P 500 Index Daily OHLCV (Date)