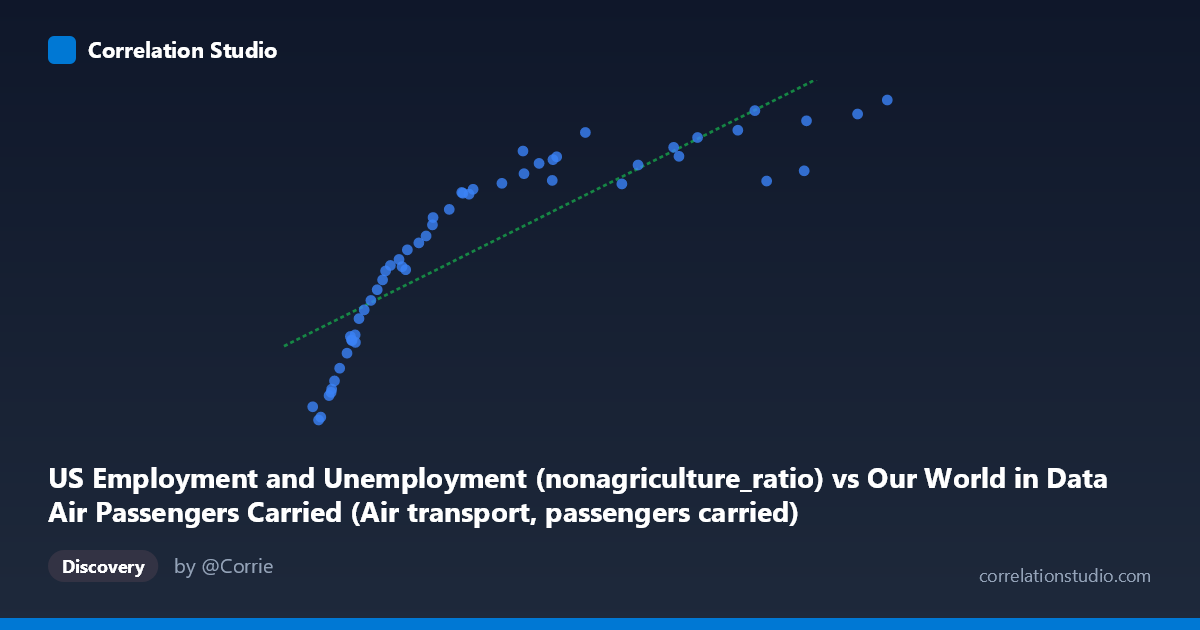
US Employment and Unemployment (nonagriculture_ratio) vs Our World in Data Air Passengers Carried (Air transport, passengers carried)
- Pearson correlation (r)
- 0.8552
- Spearman correlation
- 0.9756
- p-value
- 0
- Sample size (n)
- 54
- 95% confidence interval
- 0.7618 to 0.9137
- Granger causality
- None
- Granger optimal lag
- 10
- Time coverage
- 1970-01-01 to 2023-01-01
AI analysis
Scatterplot Analysis: US Non-Agricultural Employment Ratio vs. Global Air Passengers Carried
1. Overall Relationship Pattern
The scatterplot reveals a positive, moderately strong relationship between the US non-agricultural employment ratio and global air transport passengers carried over the period 1970–2023. As the employment ratio increases across the x-axis range (~8M to ~134M), air passenger volumes rise correspondingly from roughly 75,000 to nearly 159,000. The relationship appears broadly monotonic but with visible curvature — points at lower x-values show a steeper rate of increase that gradually flattens at higher values, consistent with a logarithmic or square-root growth pattern rather than a purely linear one. The fitted linear regression (y = 0.000596x + 93,427) captures the central tendency reasonably well but likely underestimates values at extremes.
2. Correlation Strength, Direction, and Predictive Implications
The Pearson correlation of r = 0.8552 indicates a strong positive association, and the coefficient of determination r² = 0.7313 means approximately 73% of the variance in air passengers carried is statistically explained by variation in the US non-agricultural employment ratio. This is a notably high explanatory share for a single predictor across a 53-year span. The 95% confidence interval [0.76, 0.91] is relatively tight and sits entirely above zero, and the p-value of 2.22×10⁻¹⁶ confirms the correlation is extraordinarily unlikely to be a product of chance — this is a highly statistically robust result. However, the Granger causality tests reveal no significant predictive directionality in either direction (X→Y: F=0.77, p=0.66; Y→X: F=0.87, p=0.57), even at an optimal lag of 10 periods. This is a critical caveat: despite the strong contemporaneous correlation, neither variable meaningfully predicts the future values of the other in a temporal sense, undermining any causal narrative between these two series.
3. Notable Patterns, Clusters, and Outliers
Several structural features are visible in the data: - Lower-range cluster (~8M–20M x-values): Points here show tight grouping with lower passenger volumes (75K–105K), corresponding likely to the 1970s–early 1980s period of constrained air travel and lower employment. - Mid-range dispersion (~20M–70M): This region displays the widest vertical scatter, with some points notably above or below the trend line — suggesting periods where employment and air travel diverged (potentially due to recessions, fuel crises, or pandemic effects). - Upper-range compression (~90M–134M): Several high-x-value points cluster at relatively similar y-values (137K–159K), consistent with the flattening implied by the Spearman ρ exceeding Pearson r — a key diagnostic flag for non-linearity. - Potential outlier: The point near (107M, 137,615) sits meaningfully below the linear trend given its x-value, possibly reflecting the COVID-19 air travel collapse (~2020) superimposed on otherwise high employment figures.
4. Confounding Factors and Interpretive Caveats
The most important caveat is that both variables are driven primarily by long-run macroeconomic and population growth — classic spurious correlation territory. Over 53 years, nearly any two upward-trending global metrics will correlate strongly. The non-agricultural employment ratio reflects structural US labor market evolution (shift to service economies, workforce participation changes), while air passengers carried reflects global income growth, airline deregulation, aviation technology improvements, and expanding middle classes particularly in Asia. These are parallel consequences of shared underlying drivers (GDP growth, globalization, technological progress) rather than causally linked phenomena — a conclusion directly supported by the failed Granger causality tests. Additionally, the note that Spearman ρ Pearson r confirms that the linear model is not the optimal functional form; the linear r² of 0.73 may be modestly overstating or mischaracterizing the fit compared to a logarithmic specification.
5. Actionable Insights and Further Investigation
Several concrete next steps would strengthen this analysis: - Refit with a logarithmic or polynomial model (as flagged by the Spearman divergence) to better capture the apparent curvature, likely improving r² and reducing residuals at extremes. - Detrend both series (e.g., using first differences or HP filtering) before computing correlation to isolate whether a cyclical relationship exists beyond the shared long-run trend — this would also reframe the Granger test in a stationary context. - Segment the analysis by era (pre-deregulation 1970–1978, growth phase 1979–2000, post-9/11 2001–2019, COVID disruption 2020–2023) to test whether the correlation is stable or driven by specific structural periods. - Introduce GDP per capita as a control variable in a multivariate regression to assess whether the employment–passengers correlation survives after accounting for the dominant confound. - Investigate the high-residual outlier near 107M employment / 137,615 passengers more carefully — if this is 2020, it represents a regime break worth modeling separately.
X dataset: Our World in Data Air Passengers Carried
Y dataset: US Employment and Unemployment
Part of experiment: Yearly - Our World in Data Air Passengers Carried vs US Employment and Unemployment