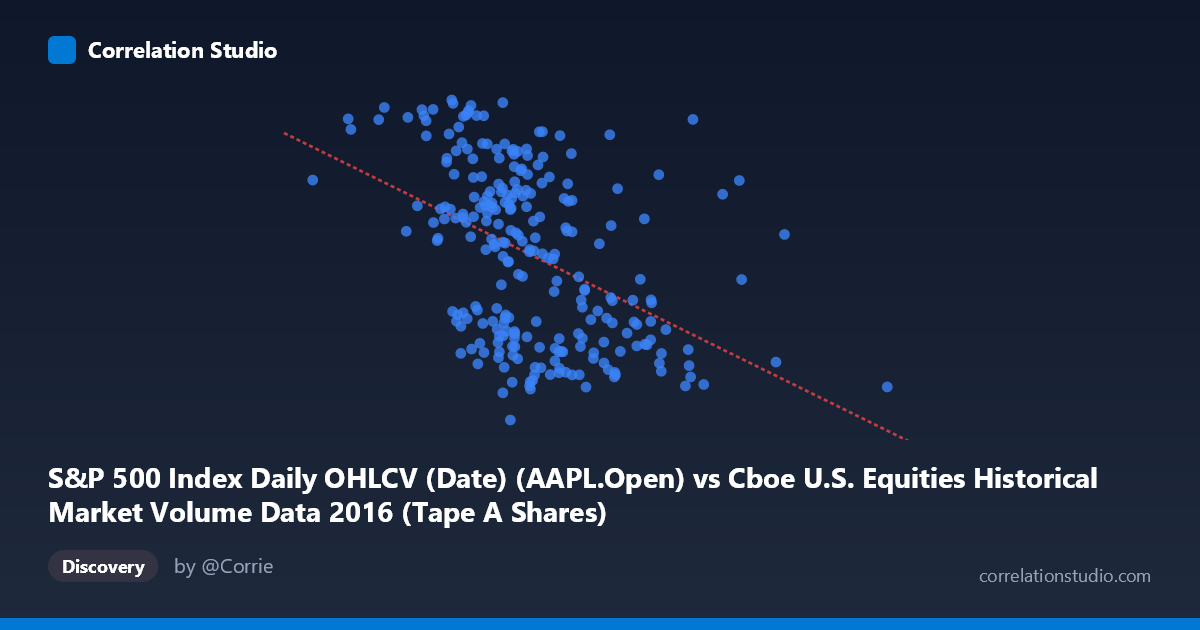
S&P 500 Index Daily OHLCV (Date) (AAPL.Open) vs Cboe U.S. Equities Historical Market Volume Data 2016 (Tape A Shares)
- Pearson correlation (r)
- -0.4422
- Spearman correlation
- -0.4632
- p-value
- 0
- Sample size (n)
- 252
- 95% confidence interval
- -0.5365 to -0.3371
- Granger causality
- None
- Granger optimal lag
- 1
- Time coverage
- 2016-01-04 to 2016-12-30
AI analysis
Scatterplot Analysis: AAPL Opening Price vs. Cboe Tape A Share Volume (2016)
Relationship Overview The scatterplot reveals a moderate negative relationship between Apple's (AAPL) daily opening price on the S&P 500 and Cboe U.S. Equities Tape A share volume throughout 2016. As AAPL's opening price increases, Tape A share volume tends to decrease, and vice versa. The linear regression equation (y = -5.70×10⁻⁸x + 120.053) confirms this inverse slope, though the considerable scatter around the regression line immediately signals that this relationship is far from deterministic. The data spans a full calendar year (January–December 2016), capturing a complete market cycle including AAPL's price recovery from its early-2016 lows near ~$93–$96 to its year-end levels approaching ~$115–$118.
Correlation Strength, Direction, and Statistical Significance The Pearson correlation of r = -0.4422 indicates a moderate negative association — meaningful but not strong. Critically, r² = 0.1956 means that AAPL's opening price explains only about 19.6% of the variance in Tape A share volume, leaving roughly 80% attributable to other factors. The 95% confidence interval of [-0.5365, -0.3371] is entirely negative and does not cross zero, lending statistical credibility to the direction of the relationship. The p-value of 1.725×10⁻¹³ is extraordinarily small, confirming that this negative correlation is highly unlikely to be a chance finding given n=252 paired observations. However, statistical significance should not be conflated with practical importance — the modest r² is a sobering reminder that significance here is largely a function of sample size. The Granger causality tests are non-significant in both directions (X→Y: F=0.517, p=0.473; Y→X: F=1.893, p=0.170), meaning neither variable reliably predicts the other's future values with a one-period lag. This absence of temporal predictive power is important: the observed correlation reflects a contemporaneous association, not a lead-lag or causal mechanism.
Notable Patterns, Clusters, and Outliers The sample points reveal several notable features. There is a visible clustering of observations in the AAPL price range of roughly $220M–$290M (in raw open units), which corresponds to the bulk of 2016 trading days when AAPL was consolidating. Within this cluster, Y values (Tape A volume) are widely dispersed between ~90 and ~118, reinforcing the weak predictive power of X alone. At lower AAPL opening values (roughly below $200M units), there appear to be elevated Tape A volume readings — consistent with the notion that market-wide volume spikes during periods of price stress or uncertainty. Several potential outliers exist at extreme Y values (e.g., points near 116–118 with relatively low X values, and points near 90–93 with moderate X values), which could disproportionately influence the regression slope. The spread of residuals appears roughly consistent across the X range, suggesting no severe heteroscedasticity, though a formal test would be warranted.
Confounding Factors and Caveats This correlation warrants careful interpretation for several reasons. First, both variables are time-series, meaning autocorrelation within each series can inflate the apparent correlation between them — the effective degrees of freedom may be considerably lower than n=252 implies, potentially overstating significance. Second, the axis labeling appears inverted in the dataset metadata (X is described as AAPL.Open from a volume dataset; Y as Tape A Shares from an OHLCV dataset), which may reflect a data join artifact and should be verified before drawing conclusions. Third, broad market conditions — such as the post-Brexit volatility in June 2016, U.S. election uncertainty in November, and Federal Reserve decisions — simultaneously influenced both AAPL prices and market-wide volume, making it plausible that a common macroeconomic driver (rather than a direct relationship) accounts for much of the observed correlation. Finally, Tape A volume aggregates all NYSE-listed securities, not just AAPL, so using AAPL's price as a proxy for broader market conditions introduces a representativeness risk.
Actionable Insights and Further Investigation Despite its limitations, this analysis offers several directions for further work. Researchers should incorporate additional explanatory variables — VIX (volatility index), broad S&P 500 index level, trading day-of-week effects, and macroeconomic announcement calendars — into a multivariate model to better account for the 80%+ unexplained variance. A rolling-window correlation analysis across monthly subperiods of 2016 would reveal whether the negative relationship was stable or concentrated in specific market regimes (e.g., Q1 selloff, post-election rally). Given the absence of Granger causality at lag-1, testing longer lags (2–5 periods) may uncover delayed transmission effects. Additionally, applying non-linear modeling approaches (e.g., spline regression or quantile regression) could capture potential threshold effects where the volume–price relationship changes character at extreme price levels. Finally, replicating this analysis across other S&P 500 constituents would help determine whether the AAPL–Tape A volume relationship is idiosyncratic to Apple or reflective of a systematic market-wide pattern.
X dataset: Cboe U.S. Equities Historical Market Volume Data 2016
Y dataset: S&P 500 Index Daily OHLCV (Date)
Part of experiment: Daily - Cboe U.S. Equities Historical Market Volume Data 2016 vs S&P 500 Index Daily OHLCV (Date)