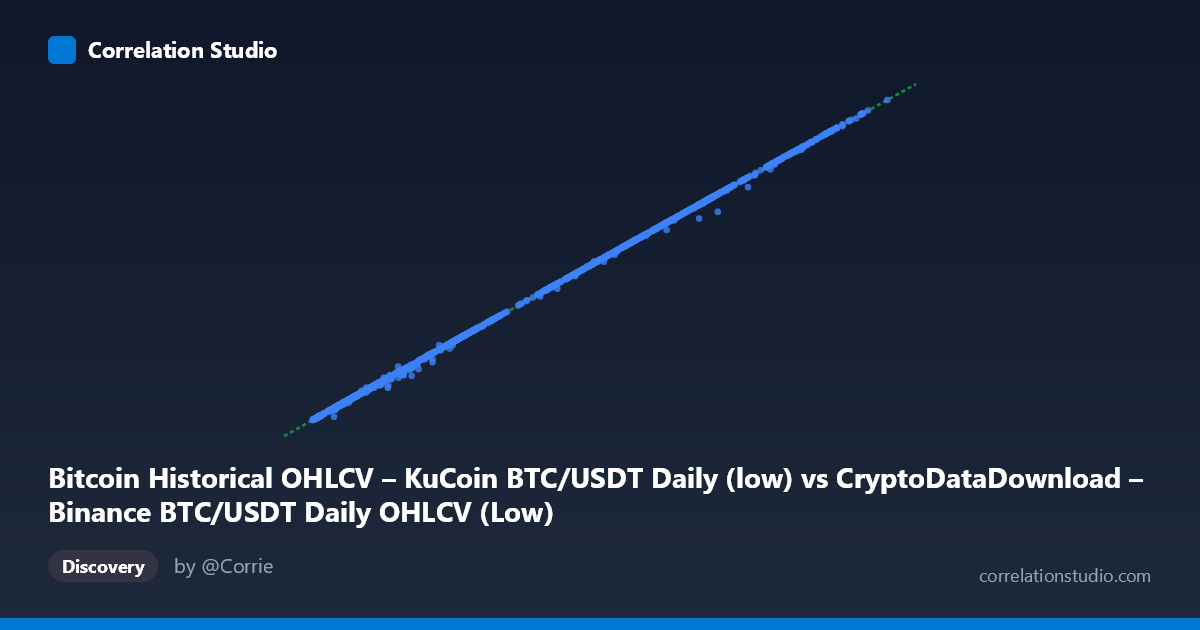
Bitcoin Historical OHLCV – KuCoin BTC/USDT Daily (low) vs CryptoDataDownload – Binance BTC/USDT Daily OHLCV (Low)
- Pearson correlation (r)
- 0.9999
- Spearman correlation
- 0.9998
- p-value
- 0
- Sample size (n)
- 1861
- 95% confidence interval
- 0.9999 to 0.9999
- Granger causality
- None
- Granger optimal lag
- 10
AI analysis
Analysis: BTC/USDT Daily Low Prices (Binance vs. KuCoin)
1. What the visualization reveals
The scatterplot shows an essentially perfect linear relationship between the daily "low" price of BTC/USDT as recorded on Binance versus KuCoin. Points fall tightly along the line y ≈ 0.9995x − 11.7, spanning the full price range from ~$3,150 to ~$66,200 (covering the 2017–2022 period, including the 2017/2021 bull runs and subsequent drawdowns). There is no visible fanning, curvature, or regime-dependent divergence — the tightness of the fit is consistent across low prices (~$3k-$10k) and high prices (~$40k-$66k) alike.
2. Strength, direction, and what it means practically
With r = 0.9999 and R² = 0.9999, essentially 100% of the variance in one exchange's low price is explained by the other's. The 95% CI [0.9999, 0.9999] and p ≈ 0 indicate this is not a statistical artifact of small sample size or noise — with n = 1,861 daily observations, the relationship is about as close to deterministic as empirical financial data gets. The slope near 1.0 (0.9995) and near-zero intercept (−11.7) confirm the two series are not just correlated but nearly identical in scale and magnitude — this is arbitrage-enforced price parity, not two independent phenomena that happen to co-move.
Importantly, the Granger causality test found no significant predictive direction in either direction (X→Y: p=0.63; Y→X: p=0.62) at the tested lag structure. This makes sense: if two exchanges are near-perfectly arbitraged, neither one's daily low "leads" the other in a way that generates forecastable lagged information — price discovery happens continuously/intraday, and daily-close-level lags are too coarse to detect any lead-lag structure that might exist at finer (minute/hour) granularity.
3. Notable patterns, clusters, and outliers
The sampled points show most pairs matching within <1% (e.g., 40911.00 vs 40910.90), but a subset show larger relative deviations at lower price levels — e.g., (7930.00, 7800.00), (5649.24, 5286.00), (6941.11, 6922.00), (7465.00, 7512.00). These gaps (~1-6%) are proportionally larger than the sub-0.1% deviations seen at higher prices, suggesting mild heteroscedasticity: absolute dollar differences are roughly constant or grow slowly with price, but percentage deviations are more pronounced in the $3k-$10k range — plausibly reflecting the earlier, less liquid market era (2017-2019) when cross-exchange arbitrage was slower or spreads were wider. No dataset-breaking outliers are apparent; all sampled deviations remain a tiny fraction of the overall $60k+ range.
4. Confounding factors and caveats
This is not a case of two "independent" datasets showing correlation — Binance and KuCoin BTC/USDT are the same underlying asset traded on different venues, mechanically linked via arbitrageurs, market makers, and cross-listed order flow. The near-1:1 relationship is expected and the "correlation" here measures market efficiency/synchronization rather than a causal or economically informative relationship between distinct variables. Caveats: (a) daily "low" is a single intra-day extremum and may not align in timestamp/timezone conventions between exchanges, explaining the small residual noise; (b) the lack of Granger causality reflects the chosen lag/frequency (daily) — high-frequency data might reveal one exchange briefly leading during volatility spikes; (c) survivorship/data-cleaning practices (missing days, outlier filtering) in each CDD source could introduce small artificial mismatches.
5. Actionable insights
Given the near-identity relationship, this pairing is best used to validate data quality (flagging days with unusually large deviations as potential data errors, gaps, or genuine cross-exchange arbitrage events/liquidity crunches) rather than for predictive modeling. For genuine lead-lag or causality research, analysts should move to intraday/tick-level data around high-volatility events (flash crashes, exchange outages) where temporary price dislocations are more likely to reveal a measurable Granger-causal direction. The residual deviations at lower price levels (2017-2019) merit closer inspection as a potential proxy for historical liquidity/arbitrage efficiency differences between these two exchanges.
X dataset: CryptoDataDownload – Binance BTC/USDT Daily OHLCV
Y dataset: Bitcoin Historical OHLCV – KuCoin BTC/USDT Daily
Part of experiment: Bitcoin - CryptoDataDownload – Binance BTC/USDT Daily OHLCV vs Bitcoin Historical OHLCV – KuCoin BTC/USDT Daily