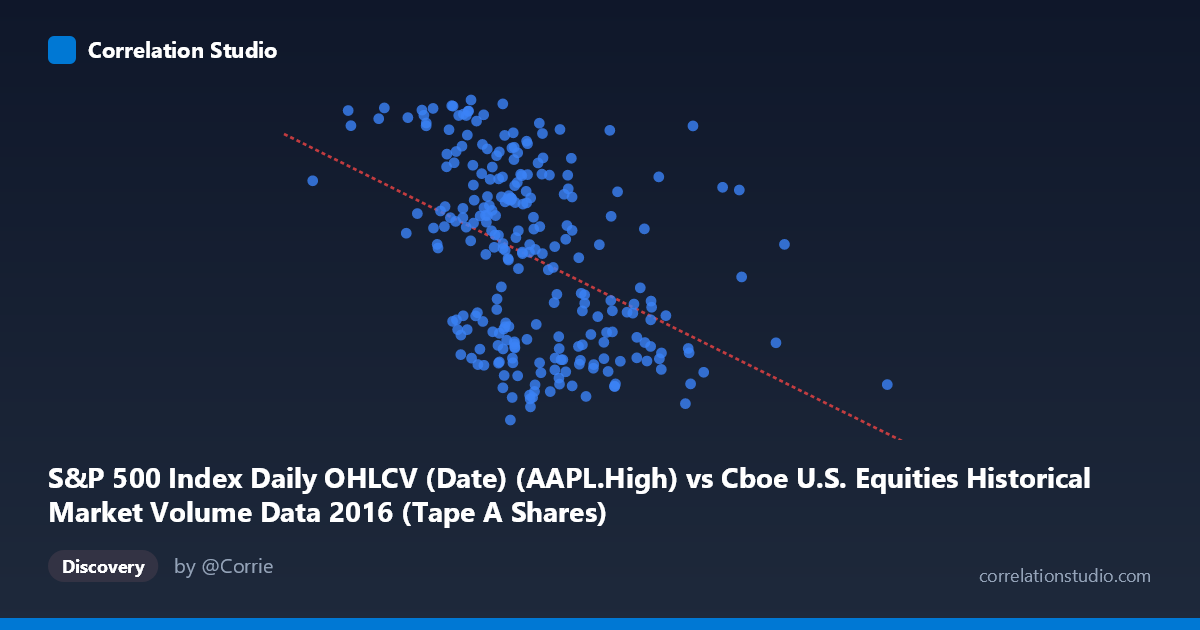
S&P 500 Index Daily OHLCV (Date) (AAPL.High) vs Cboe U.S. Equities Historical Market Volume Data 2016 (Tape A Shares)
- Pearson correlation (r)
- -0.4287
- Spearman correlation
- -0.4497
- p-value
- 0
- Sample size (n)
- 252
- 95% confidence interval
- -0.5245 to -0.3222
- Granger causality
- None
- Granger optimal lag
- 1
AI analysis
Scatterplot Analysis: AAPL High Price vs. Cboe Tape A Shares Volume
Relationship Overview
The scatterplot reveals a moderate negative relationship between Apple's daily high price (X-axis) and Cboe Tape A share volume (Y-axis) across 2016. As AAPL's intraday high increases, Tape A share volume tends to decrease, which is counterintuitive at first glance but reflects a well-documented market dynamic: rising blue-chip prices are often associated with calmer, lower-volume market conditions, whereas declining prices frequently coincide with elevated trading activity driven by fear, repositioning, and forced selling. The linear regression equation (y = -5.508E-08x + 120.435) confirms this downward slope, though the scatter is considerable, indicating the relationship is real but far from deterministic.
Correlation Strength and Statistical Significance
The Pearson correlation of r = -0.4287 indicates a moderate negative association, but the explained variance tells a more sobering story: R² = 0.1838 means only 18.4% of the variance in Tape A volume is explained by AAPL's high price, leaving over 81% attributable to other factors. The 95% confidence interval of [-0.5245, -0.3222] is entirely negative and meaningfully far from zero, confirming directional reliability. The p-value of 1.09E-12 is overwhelmingly significant given n = 252 paired observations, making random chance an implausible explanation. However, statistical significance here is largely a function of sample size — the practical effect size remains modest. Critically, the Granger causality tests show no significant predictive directionality in either direction (X→Y: F = 0.37, p = 0.54; Y→X: F = 2.22, p = 0.14), meaning neither variable reliably predicts the other's future values at the tested lag of 1 period. This effectively rules out a simple temporal or causal mechanism between the two series.
Notable Patterns, Clusters, and Outliers
Several features stand out in the sample data. There is a visible clustering of observations in the AAPL high range of roughly $210M–$310M (in index units), with Tape A volume scattered broadly between ~92 and ~118, suggesting high variance within the most common price range. Points at the lower end of the X-axis (e.g., ~176M, 190M) tend to pair with notably elevated Y values (~107–117), consistent with the negative trend. Conversely, higher X values (e.g., ~335M, ~363M) cluster toward lower Y values (~94–97). A few apparent outliers — such as the point near (256M, 91.67) representing the minimum Y value, and (278M, 116.73) as a high-volume outlier amid a mid-range price — suggest episodic volume spikes that the linear model cannot capture. There is no strong evidence of a nonlinear structure from the sample, but the variance appears to fan outward slightly at mid-range X values, hinting at possible heteroscedasticity.
Confounding Factors and Caveats
Several important caveats apply. First, the axis labels appear to be swapped in dataset attribution — AAPL High is drawn from a market volume dataset and Tape A shares from an OHLCV dataset, which may indicate a data joining artifact or labeling error that warrants verification before drawing firm conclusions. Second, both series are time-indexed across 2016, meaning macroeconomic events (Brexit vote in June, U.S. election in November), earnings announcements, and Federal Reserve decisions likely introduced correlated shocks to both variables simultaneously — a classic confounding scenario. Third, Tape A volume aggregates all NYSE-listed securities, making it a broad market measure rather than an AAPL-specific one; the negative correlation may partly reflect risk-off periods when broad volume surges while individual growth stocks like AAPL sell off. Finally, the absence of Granger causality at lag 1 does not rule out causality at longer lags or through indirect channels.
Actionable Insights and Further Investigation
Despite the modest R², the consistent negative directionality and highly significant p-value suggest this relationship merits further structured investigation. Key next steps would include: (1) testing Granger causality at lags 2–10 to check for delayed feedback loops; (2) segmenting the data by market regime (high-VIX vs. low-VIX periods) to determine if the correlation strengthens during stress events; (3) partial correlation analysis controlling for the VIX, S&P 500 returns, and broader market volume to isolate whether AAPL price uniquely drives volume patterns; and (4) resolving the dataset attribution ambiguity to ensure the variables are correctly assigned. If the negative relationship holds after controls, it could support a practical signal: elevated AAPL prices in calm markets may be a mild indicator of suppressed broad market trading activity, useful for liquidity-sensitive trading strategies.
X dataset: Cboe U.S. Equities Historical Market Volume Data 2016
Y dataset: S&P 500 Index Daily OHLCV (Date)
Part of experiment: Daily - Cboe U.S. Equities Historical Market Volume Data 2016 vs S&P 500 Index Daily OHLCV (Date)