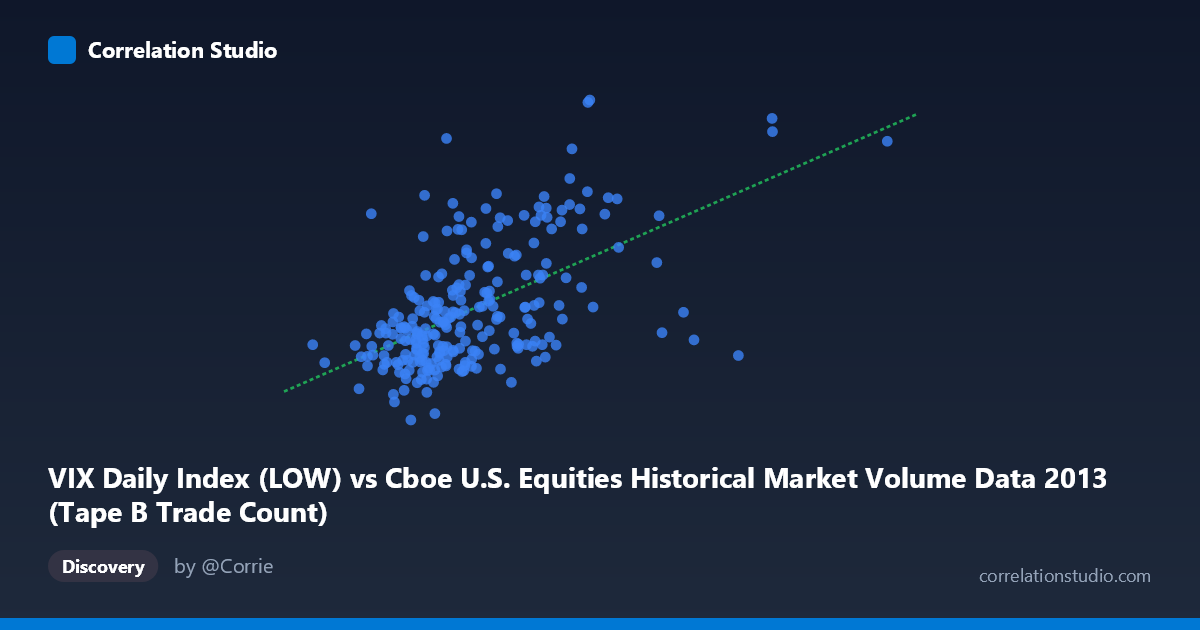
VIX Daily Index (LOW) vs Cboe U.S. Equities Historical Market Volume Data 2013 (Tape B Trade Count)
- Pearson correlation (r)
- 0.5633
- Spearman correlation
- 0.5301
- p-value
- 0
- Sample size (n)
- 252
- 95% confidence interval
- 0.4726 to 0.6421
- Granger causality
- None
- Granger optimal lag
- 1
AI analysis
Analysis: VIX Daily Index (LOW) vs. Tape B Trade Count (2013)
Relationship Overview The scatterplot reveals a moderate positive relationship between the VIX Daily Index Low values and Cboe U.S. Equities Tape B Trade Count throughout 2013. As the VIX low values increase — indicating elevated baseline volatility — Tape B trade counts tend to rise correspondingly. The linear regression equation (y = 1.916×10⁻⁵x + 10.47) confirms this upward slope, suggesting that higher volatility floor levels are associated with meaningfully increased trading activity on Tape B exchanges. This relationship is intuitive: periods of heightened market uncertainty tend to drive greater retail and institutional trading participation across all tape categories.
Correlation Strength and Statistical Significance The correlation coefficient of r = 0.563 represents a moderate positive association, but the explanatory power requires careful framing: r² = 0.317 means only ~31.7% of the variance in Tape B trade counts is explained by VIX low values, leaving roughly 68% attributable to other factors. The 95% confidence interval of [0.473, 0.642] is meaningfully narrow given the sample size (n = 252), and the p-value of effectively zero confirms this is not a chance finding across the N = 3,780 population. However, the Granger causality results are notably absent in both directions — neither X→Y (F = 0.369, p = 0.544) nor Y→X (F = 0.712, p = 0.400) achieves significance at lag-1. This is a critical caveat: despite the meaningful contemporaneous correlation, VIX low values do not temporally predict next-period trade counts, nor vice versa, suggesting the relationship is synchronous rather than directionally causal.
Notable Patterns and Outliers The sample points reveal considerable heteroscedasticity — variance in trade counts appears to fan outward at higher VIX values (above ~220,000–250,000 on the x-axis), with several notable outliers. The point near (241,065, 18.98) and another near (230,708, 17.08) sit well above the regression line, suggesting episodic volatility spikes that dramatically amplify trading beyond what the linear model predicts. Conversely, the point near (327,004, 12.66) represents a high-VIX-low day with surprisingly subdued trade counts — a potential anomaly worth investigating. The bulk of observations cluster in the x-range of roughly 130,000–220,000, with trade counts concentrated between 12 and 16, indicating a dense "normal operating regime" from which outliers depart episodically.
Confounding Factors and Caveats Several confounding factors complicate interpretation. First, Tape B specifically covers NYSE American (AMEX) and regional exchange listings, meaning its trade count dynamics may be influenced by sector-specific events (e.g., small-cap volatility, ETF activity) that correlate with but are not driven by broad VIX movements. Second, the 2013 timeframe was characterized by a generally declining VIX environment post-2012 fiscal cliff concerns, meaning temporal autocorrelation could be inflating the apparent cross-sectional relationship. Third, algorithmic and high-frequency trading volumes on Tape B can spike independently of VIX for purely technical or liquidity-provision reasons. Finally, using the VIX low (rather than close or average) introduces a specific measurement choice that may not best represent the day's overall volatility regime.
Actionable Insights and Further Investigation Practitioners should avoid using VIX low as a standalone predictor of Tape B volume given the failed Granger tests — any operational model relying on this relationship for next-day forecasting would be unreliable. Instead, further investigation should explore: (1) non-linear or threshold models, since the outlier cluster at high VIX values suggests a regime-switching dynamic where above a VIX threshold of ~17–18, trade counts become highly sensitive; (2) multivariate regression incorporating VIX open/close spread, overall market volume (Tapes A and C), and macroeconomic event calendars; (3) rolling-window correlation analysis to test whether the relationship strengthens during specific volatility regimes. The synchronous but non-causal nature of this relationship suggests both variables may be jointly driven by a common latent factor — such as news shock intensity or institutional risk appetite — which would be the more productive target for predictive modeling.
X dataset: Cboe U.S. Equities Historical Market Volume Data 2013
Y dataset: VIX Daily Index
Part of experiment: Daily - Cboe U.S. Equities Historical Market Volume Data 2013 vs VIX Daily Index