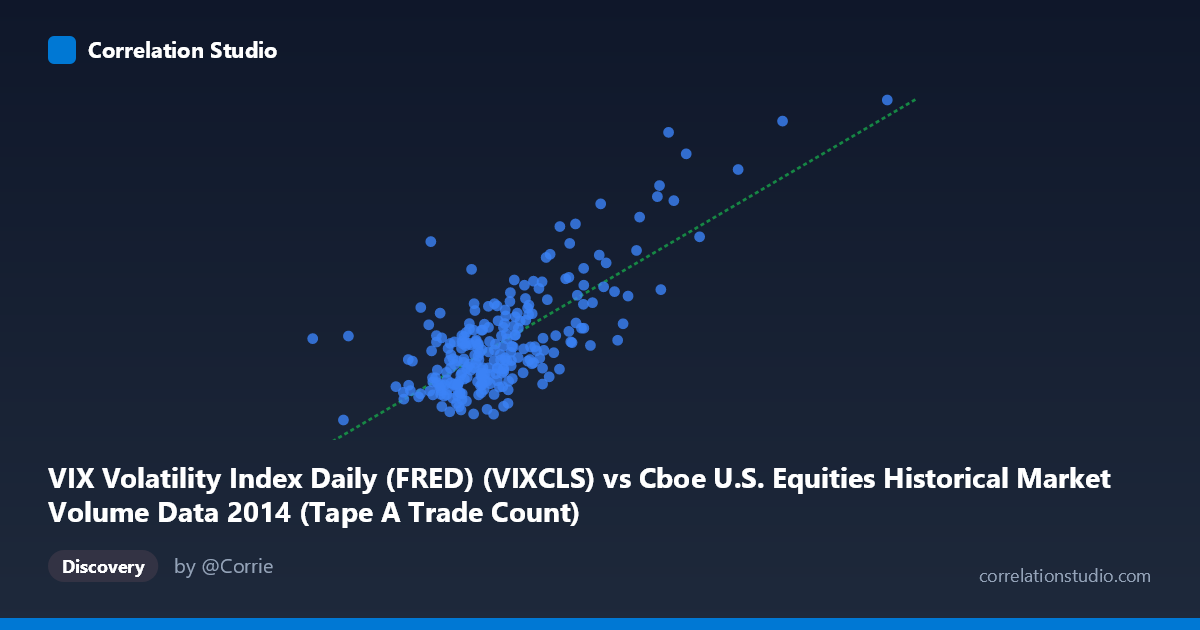
VIX Volatility Index Daily (FRED) (VIXCLS) vs Cboe U.S. Equities Historical Market Volume Data 2014 (Tape A Trade Count)
- Pearson correlation (r)
- 0.7478
- Spearman correlation
- 0.5929
- p-value
- 0
- Sample size (n)
- 252
- 95% confidence interval
- 0.6878 to 0.7977
- Granger causality
- None
- Granger optimal lag
- 1
AI analysis
Analysis: VIX Volatility Index vs. Tape A Trade Count (2014)
Relationship Overview The scatterplot reveals a moderately strong positive relationship between the VIX Volatility Index and Cboe Tape A Trade Count across 252 trading days in 2014. As implied volatility rises, trade counts tend to increase correspondingly — a relationship that aligns intuitively with market microstructure theory: heightened fear and uncertainty drive elevated trading activity as market participants reposition, hedge, and react to perceived risk. The linear regression equation (y = 8.34×10⁻⁶x + 4.28) suggests that each unit increase in VIX is associated with a meaningful uptick in trade volume, though the relationship is clearly not perfectly linear across the full range of observations.
Correlation Strength and Statistical Significance The correlation coefficient of r = 0.748 indicates a moderately strong positive association, but the more meaningful figure is r² = 0.559 — meaning VIX explains approximately 55.9% of the variance in Tape A Trade Count. While substantial, this also implies that roughly 44% of trading volume variation is driven by factors outside of implied volatility alone. The 95% confidence interval of [0.688, 0.798] is relatively tight, reflecting high precision from the large population (N = 3,686), and the p-value of effectively zero confirms the relationship is not attributable to chance. However, the Granger causality results complicate the narrative: neither direction achieves conventional significance (X→Y: F = 3.38, p = 0.067; Y→X: F = 0.21, p = 0.645). The X→Y direction approaches but misses the 0.05 threshold, suggesting VIX may have marginal predictive power for next-period trade counts, but this cannot be asserted confidently. Crucially, there is no evidence that trade counts predict VIX, ruling out reverse causation at lag-1.
Notable Patterns, Clusters, and Outliers The data displays a clear right-tail cluster of high-leverage points — most visibly around coordinates (2,171,498, 25.20) and (1,834,381, 23.57), which correspond to periods of elevated market stress (likely the October 2014 market selloff and geopolitical volatility events). These outlier observations exert disproportionate influence on the regression line and r value. The bulk of observations cluster in a dense low-to-moderate range (X: ~900,000–1,400,000; Y: ~11–17), where the relationship appears more diffuse and the linear fit less convincing. This bimodal distribution — a tight cluster at normal conditions and a dispersed tail at stress events — hints at a non-linear or threshold relationship, where VIX's predictive power for trade volume may only activate meaningfully above certain volatility levels. The point at (527,319, 14.37) is a notable low-volume outlier that sits off the main cluster, potentially representing a holiday-shortened or anomalous trading session.
Confounding Factors and Caveats Several important caveats apply. First, temporal autocorrelation is almost certain in daily financial data — both VIX and trade counts exhibit serial dependence, which can artificially inflate correlation statistics and violate OLS regression assumptions. Second, market calendar effects (quarter-end rebalancing, options expiration cycles, earnings seasons) independently drive both variables simultaneously, acting as common causes rather than evidence of a direct causal link. Third, the axis label assignment appears transposed in the metadata — VIX is listed as the X-axis variable drawn from the Cboe market volume dataset, and vice versa, which warrants verification before drawing firm conclusions. Fourth, Tape A specifically covers NYSE-listed securities, so this relationship may not generalize to Tape B or C venues, and any 2014-specific regulatory or structural market changes (e.g., exchange fee adjustments) could confound volume trends independently of VIX.
Actionable Insights and Further Investigation Practitioners should treat VIX as a useful but incomplete signal for anticipating trading activity — sufficient for broad capacity planning or liquidity estimation, but insufficient as a standalone predictor. A regime-based analysis separating low-volatility (VIX < 15) from high-volatility (VIX 20) periods would likely reveal meaningfully different correlation structures and could improve model accuracy. Extending the Granger causality test to longer lags (2–5 periods) may uncover delayed predictive relationships not captured at lag-1. Incorporating additional predictors — such as S&P 500 returns, macroeconomic announcements, or cross-venue volume data — into a multivariate model would help capture the unexplained 44% variance. Finally, replicating this analysis across multiple years (particularly 2008–2009 or 2020) would test whether the relationship strengthens materially during extreme stress regimes, which has direct implications for exchange infrastructure and market-maker risk management.
X dataset: Cboe U.S. Equities Historical Market Volume Data 2014
Y dataset: VIX Volatility Index Daily (FRED)
Part of experiment: Daily - Cboe U.S. Equities Historical Market Volume Data 2014 vs VIX Volatility Index Daily (FRED)