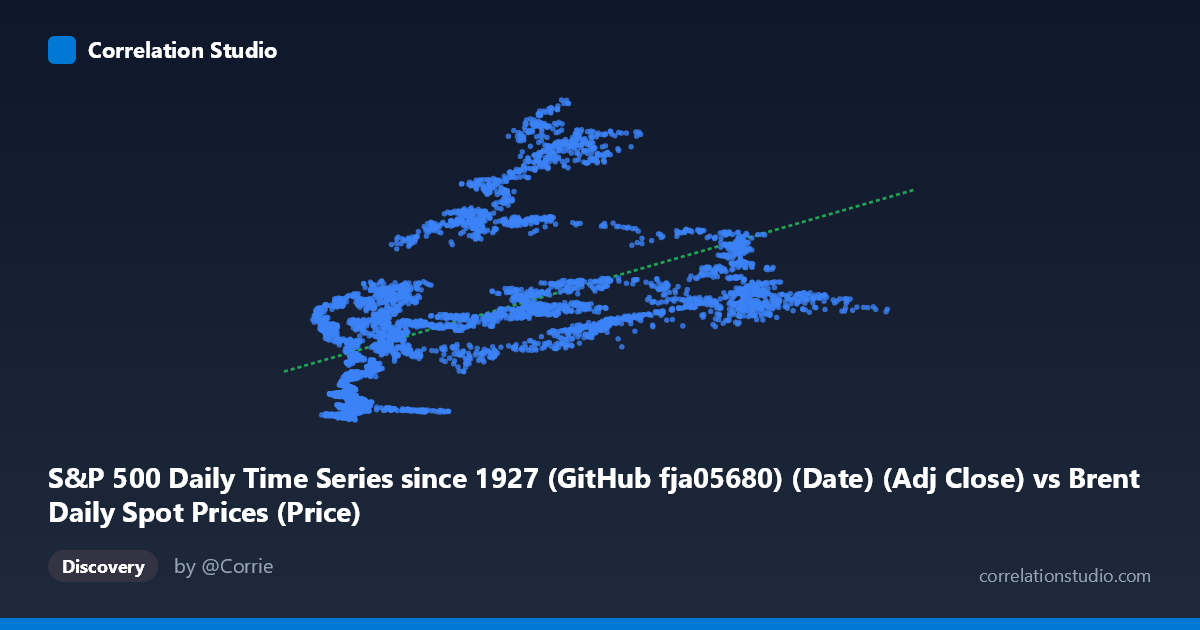
S&P 500 Daily Time Series since 1927 (GitHub fja05680) (Date) (Adj Close) vs Brent Daily Spot Prices (Price)
- Pearson correlation (r)
- 0.5378
- Spearman correlation
- 0.6915
- p-value
- 0
- Sample size (n)
- 8140
- 95% confidence interval
- 0.5221 to 0.553
- Granger causality
- None
- Granger optimal lag
- 1
AI analysis
Analysis: Brent Crude Oil Prices vs. S&P 500
1. Overall Relationship
The scatterplot reveals a positive but notably dispersed relationship between Brent crude oil spot prices (X-axis, USD/barrel) and S&P 500 adjusted closing values (Y-axis). The linear regression line (y = 11.521x + 650.956) slopes upward, confirming the positive direction, but the substantial scatter around that line tells the more important story: for virtually any given crude oil price level, S&P 500 values span an enormous range. For example, oil prices in the 60–70 USD/barrel range correspond to S&P 500 values anywhere from roughly 900 to over 3,200 — a spread that dwarfs any predictive signal. The dataset spans over three decades (1987–2019), meaning both series have been substantially shaped by independent long-run growth trends, which likely inflates the apparent co-movement.
2. Correlation Strength and Statistical Framing
The Pearson r of 0.5378 indicates a moderate positive correlation, but the explanatory power is considerably more modest than that headline figure suggests. The R² of 0.2892 means that Brent crude prices account for only ~29% of the variance in S&P 500 levels — leaving roughly 71% of variance unexplained by this relationship alone. The 95% confidence interval for r of [0.5221, 0.5530] is quite tight, reflecting the large paired sample (n = 8,140), and the p-value of effectively 0 confirms the correlation is highly statistically significant. However, statistical significance here is almost trivially guaranteed by the sample size; it says nothing about practical or causal importance. Critically, the Granger causality tests fail in both directions (X→Y: F = 0.9039, p = 0.342; Y→X: F = 0.8629, p = 0.353), meaning neither series meaningfully predicts the other at a one-period lag. This is a crucial finding: whatever correlation exists appears to be contemporaneous and non-causal, likely driven by shared exposure to common macroeconomic forces rather than any directional relationship.
3. Notable Patterns, Clusters, and Non-Linearity
Several structural features stand out in the data:
- Lower-left clustering: A dense concentration of points at low oil prices (10–30 USD/barrel) paired with low-to-moderate S&P values (roughly 200–1,200), consistent with the pre-2000 era when both series were at lower absolute levels. - Fan-shaped dispersion: As oil prices increase, the vertical spread in S&P values widens dramatically, suggesting heteroscedasticity — the relationship is far less predictable at higher oil price levels. - High-S&P outliers at moderate oil prices: Several points show S&P values above 2,500–3,200 at oil prices in the 60–110 range, consistent with the post-2013 bull market period when equities surged despite oil volatility. - Non-linearity flag: The fact that Spearman ρ exceeds Pearson r explicitly suggests the relationship is better described by a monotonic but non-linear function. A logarithmic or polynomial fit would likely capture the curvature better — diminishing returns in the S&P response as oil prices rise beyond moderate levels.
4. Confounding Factors and Interpretive Caveats
This correlation carries several serious interpretive hazards:
- Shared time trend (spurious correlation): Both series exhibit strong long-run upward trends over 1987–2019 driven by inflation, economic growth, and dollar dynamics. Much of the r = 0.54 may simply reflect two trending series moving upward together over time rather than any genuine economic linkage. First-differencing or detrending would be a necessary robustness check. - Regime changes: The relationship almost certainly differs across economic regimes — oil price spikes driven by supply shocks (e.g., Gulf War, 2008) have historically been negative for equities, while oil and equity prices rise together during demand-driven expansions. Pooling these regimes suppresses the true conditional dynamics. - Axis labeling note: The dataset metadata appears to have the axis labels inverted (X column labeled as "Date/Adj Close" from S&P, Y labeled from Brent). This should be verified before drawing any directional conclusions. - Omitted variables: Global GDP growth, Federal Reserve policy, the US dollar index, and geopolitical risk are all correlated with both series and are entirely uncontrolled here.
5. Actionable Insights and Further Investigation
Given the limitations above, several investigative directions would substantially improve understanding:
1. Detrend both series (e.g., first differences or log returns) before re-running correlation and Granger tests — this would eliminate the spurious trend-driven component and reveal whether any true short-run relationship exists. 2. Regime-segmented analysis: Split the data into demand-shock vs. supply-shock oil environments and test whether the correlation sign and magnitude differ across regimes, as theory would predict. 3. Test non-linear specifications: Fit logarithmic and polynomial regression models and compare AIC/BIC against the linear model to formally confirm the Spearman ρ Pearson r suggestion. 4. Extend Granger lag structure: Test beyond the optimal lag of 1 period — energy market effects on corporate earnings may manifest over weeks or quarters rather than a single trading day. 5. Multivariate modeling: Introduce the USD index and global PMI as controls to isolate whether any residual oil-equity relationship survives after accounting for the dominant macro drivers.
The bottom line: while the correlation is statistically robust, it is economically modest, non-causal by temporal tests, and likely substantially spurious due to shared long-run trends. Investors or analysts should be cautious about using crude oil prices as a standalone predictor of equity market levels.
X dataset: Brent Daily Spot Prices
Y dataset: S&P 500 Daily Time Series since 1927 (GitHub fja05680) (Date)
Part of experiment: Daily - Brent Daily Spot Prices vs S&P 500 Daily Time Series since 1927 (GitHub fja05680) (Date)