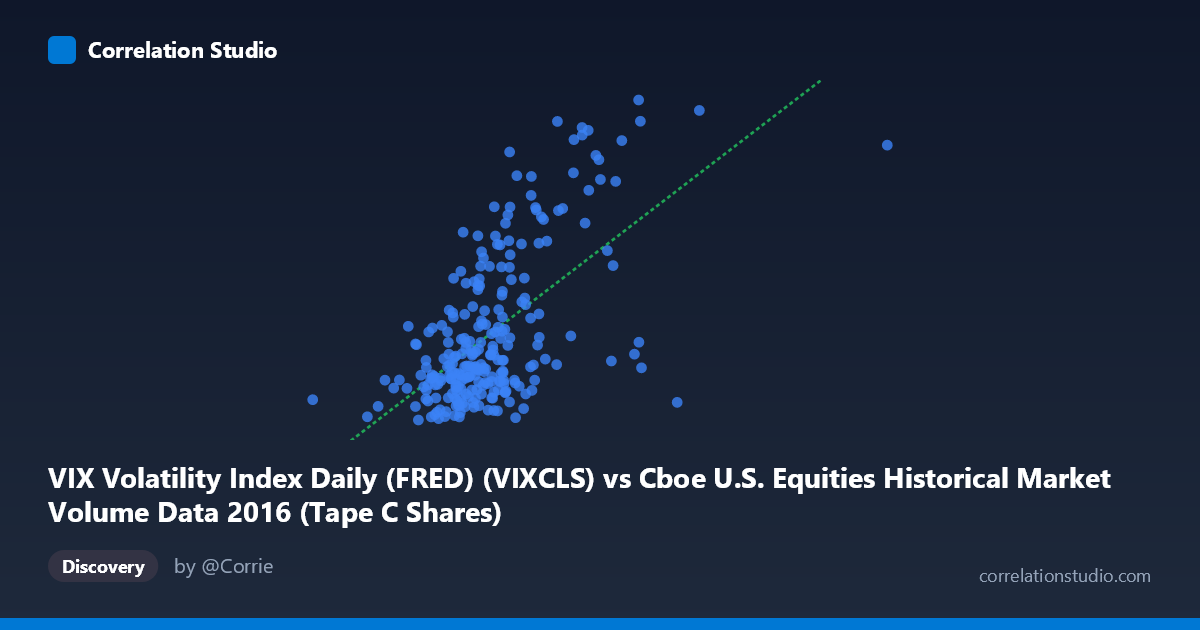
VIX Volatility Index Daily (FRED) (VIXCLS) vs Cboe U.S. Equities Historical Market Volume Data 2016 (Tape C Shares)
- Pearson correlation (r)
- 0.6028
- Spearman correlation
- 0.5216
- p-value
- 0
- Sample size (n)
- 252
- 95% confidence interval
- 0.5179 to 0.6761
- Granger causality
- None
- Granger optimal lag
- 1
AI analysis
Analysis: VIX Volatility Index vs. Cboe Tape C Share Volume (2016)
Relationship Overview The scatterplot reveals a moderate positive relationship between Cboe U.S. Equities market volume (Tape C shares, X-axis) and the VIX Volatility Index (Y-axis) across 252 trading days in 2016. As market volume increases, implied volatility tends to rise — a directionally intuitive finding, since periods of market stress or uncertainty typically drive both elevated trading activity and higher fear-gauge readings. The linear regression equation (y = 8.79×10⁻⁸x + 4.14) confirms this positive slope, though the intercept and scale of the coefficient reflect the large magnitude of the share volume figures involved.
Correlation Strength and Statistical Significance The Pearson correlation of r = 0.60 indicates a moderate positive association, but the explanatory power is more sobering: R² = 0.363, meaning volume accounts for only about 36.3% of the variance in VIX levels, leaving nearly two-thirds of VIX variability unexplained by this variable alone. The 95% confidence interval [0.52, 0.68] is reasonably tight and does not cross zero, and the p-value of effectively 0 confirms this correlation is statistically significant across the 252-point sample drawn from a population of 3,622 observations. However, the Granger causality results tell a critical story: neither direction (X→Y: F=0.0009, p=0.976; Y→X: F=0.12, p=0.729) reaches significance, meaning neither variable temporally predicts the other at a one-period lag. This strongly cautions against any causal or predictive interpretation — the correlation is contemporaneous and associative, not directionally predictive.
Notable Patterns, Clusters, and Outliers The data points are not uniformly distributed. A dense central cluster sits roughly between 110–140M shares and VIX values of 12–18, representing the "quiet" baseline of 2016 trading. More importantly, there is a visually distinct upper-right scatter of outliers — points with both very high volume (150–175M+) and elevated VIX (22–28), likely corresponding to specific market stress episodes in 2016 (e.g., Brexit in late June, the U.S. election in November). The point at approximately (175M, 26.7) is particularly notable as a potential high-leverage outlier. There is also a lower-right anomaly cluster — high volume but low-to-moderate VIX — suggesting that some high-volume days were driven by structural or technical factors rather than fear. This heteroscedasticity (variance in VIX increasing at higher volume levels) hints that a linear model may not fully capture the relationship.
Confounding Factors and Caveats Several important caveats apply. First, both VIX and trading volume are jointly driven by external market events (geopolitical shocks, earnings seasons, central bank announcements), making the observed correlation likely a shared response to common causes rather than a direct link. Second, Tape C shares represent only one market segment (NYSE Arca-listed securities), which may behave differently from the broader market captured by VIX. Third, the data is confined to 2016 alone, a year with notable idiosyncratic events (Brexit, U.S. election), which may inflate the correlation compared to a more stable year. Fourth, the absence of Granger causality at a one-day lag does not rule out causality at different frequencies or longer lags — intraday dynamics may matter more than daily closes.
Actionable Insights and Further Investigation Given the moderate but non-causal relationship, practitioners should avoid using daily volume alone as a VIX predictor. Worthwhile next steps include: (1) testing multiple lag lengths in Granger causality analysis to rule out relationships at 2–5 day lags; (2) segmenting the data by market regime (low vs. high volatility periods) to assess whether the correlation strengthens during stress events; (3) incorporating additional predictors — such as options volume, bid-ask spreads, or news sentiment — to build a more complete model of VIX drivers; and (4) extending the analysis across multiple years to test whether the 2016 relationship is stable or event-driven. The outlier cluster warrants separate event-study analysis to identify whether volume-VIX spikes cluster around identifiable macro events.
X dataset: Cboe U.S. Equities Historical Market Volume Data 2016
Y dataset: VIX Volatility Index Daily (FRED)
Part of experiment: Daily - Cboe U.S. Equities Historical Market Volume Data 2016 vs VIX Volatility Index Daily (FRED)