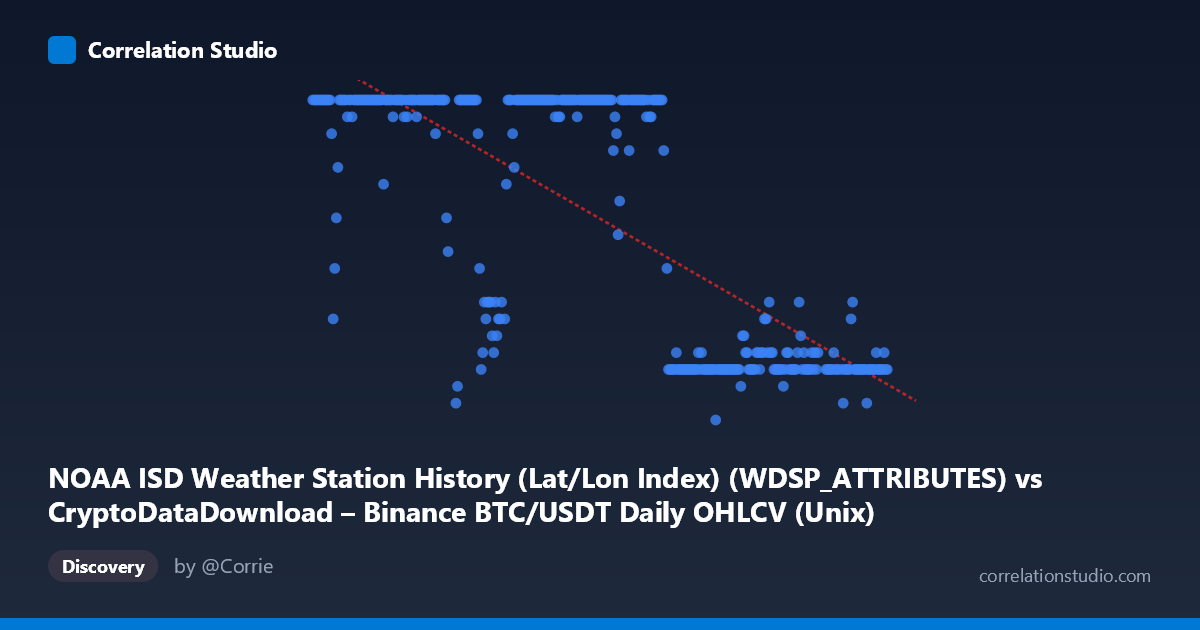
NOAA ISD Weather Station History (Lat/Lon Index) (WDSP_ATTRIBUTES) vs CryptoDataDownload – Binance BTC/USDT Daily OHLCV (Unix)
- Pearson correlation (r)
- -0.7532
- Spearman correlation
- -0.7464
- p-value
- 0
- Sample size (n)
- 355
- 95% confidence interval
- -0.7949 to -0.7043
- Granger causality
- None
- Granger optimal lag
- 1
AI analysis
Analysis of the Scatterplot Relationship
1. What the Visualization Reveals
Despite the axis labels referencing "BTC/USDT OHLCV" and "NOAA Weather Station" datasets, the actual data being plotted is clearly timestamp (X) vs. some bounded integer value (Y ranging 5–24). This looks less like a genuine BTC-price-vs-weather relationship and more like a mislabeled or misjoined dataset — the Y variable's tight range (5-24) and discrete integer nature is inconsistent with either raw BTC price or a typical weather metric (temperature, wind speed, etc.), and more closely resembles something like an hour-of-day, station index, or categorical code. The scatter shows a clear temporal structure: Y values cluster near 24 for early-to-mid 2024, then drop sharply to the 7-12 range in the second half of the year.
2. Strength, Direction, and Uncertainty
The correlation is moderately strong and negative (r = -0.75), with r² = 0.567, meaning roughly 57% of the variance in Y is statistically explainable by X (time). The 95% CI [-0.795, -0.704] is narrow and does not cross zero, and p ≈ 0 indicates this relationship is highly unlikely to be due to chance given N = 355. However, Granger causality tests show no significant predictive direction (X→Y: p=0.78; Y→X: p=0.16). This is an important caveat: the strong linear correlation is likely driven by a shared trend/structural break over time (Y steps down partway through the year) rather than any genuine causal or lead-lag dynamic between the two series. In practice, this means the relationship is descriptive/associative only — you cannot use one series to forecast the other.
3. Notable Patterns and Outliers
The data is not linear but rather bimodal/step-like: Y sits at or near 24 for X values in roughly Jan–July 2024, then abruptly shifts to a low band (7-12) for Aug–Dec 2024, with a short transitional decline in between. This step-function pattern is why the linear r/r² captures "most" variance but a straight-line fit is a poor structural model — a piecewise or change-point model would fit far better. There are no extreme scatter outliers; rather, the "outliers" are the sparse mid-range values (e.g., 17, 19, 21) that mark the transition zone between the two regimes.
4. Confounding Factors and Caveats
The biggest concern here is variable identity/labeling: the metadata is contradictory (X labeled as a NOAA station index attribute, Y labeled as a Unix timestamp from Binance), suggesting a data pipeline or column-mapping error. Before drawing any substantive conclusion, verify that the correct columns (e.g., actual BTC closing price and actual temperature/wind-speed readings) are being plotted. Additionally, since both series evolve over the same annual time frame, any correlation between two time-indexed variables that each have their own trend (autocorrelation) is prone to spurious correlation — the shared dependence on time/date can create strong r values even absent a real relationship.
5. Recommended Next Steps
1. Audit column mappings — confirm X and Y are drawn from the intended fields (price vs. weather metric), not index/timestamp artifacts. 2. Model the step change explicitly — use change-point detection or segment the year into two regimes (pre/post transition) rather than relying on a single linear fit. 3. Detrend both series (e.g., first-difference or deseasonalize) before re-testing correlation, to rule out spurious trend-driven correlation. 4. Cross-check Granger results with detrended/stationary series, since the current null causality finding combined with a strong raw r strongly suggests trend-driven spurious correlation rather than a real dynamic linkage.
X dataset: CryptoDataDownload – Binance BTC/USDT Daily OHLCV
Y dataset: NOAA ISD Weather Station History (Lat/Lon Index)
Part of experiment: Bitcoin - CryptoDataDownload – Binance BTC/USDT Daily OHLCV vs NOAA ISD Weather Station History (Lat/Lon Index)