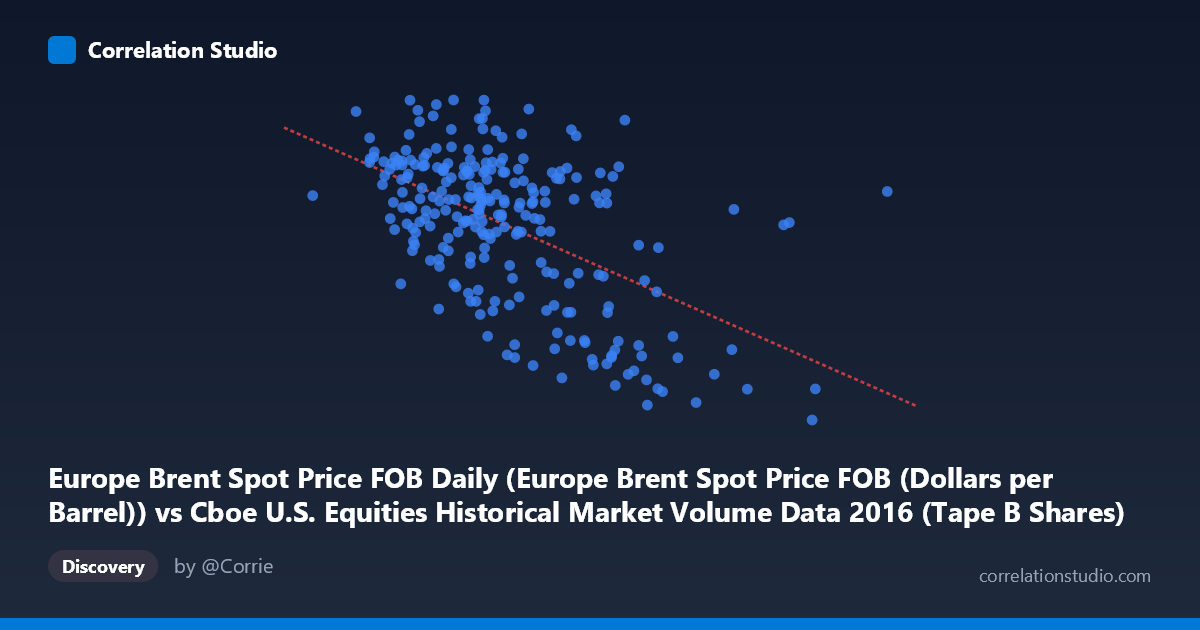
Europe Brent Spot Price FOB Daily (Europe Brent Spot Price FOB (Dollars per Barrel)) vs Cboe U.S. Equities Historical Market Volume Data 2016 (Tape B Shares)
- Pearson correlation (r)
- -0.5451
- Spearman correlation
- -0.4808
- p-value
- 0
- Sample size (n)
- 251
- 95% confidence interval
- -0.6266 to -0.4517
- Granger causality
- None
- Granger optimal lag
- 1
- Time coverage
- 2016-01-04 to 2016-12-30
- Recomputed on refreshed data
- 2026-10-21 (r was -0.5451)
AI analysis
Analysis: Europe Brent Spot Price vs. Cboe Tape B Share Volume (2016)
Relationship Overview The scatterplot reveals a moderate negative relationship between Europe Brent crude oil spot prices (X-axis, in dollars per barrel) and Cboe Tape B share volume (Y-axis). As oil prices increase, trading volume in Tape B equities tends to decrease, and conversely, lower oil prices are associated with higher trading volumes. The linear regression equation (y = -1.20262E⁻⁰⁷x + 56.57) confirms this inverse slope, suggesting that for every ~8.3 million dollar increase in the notional X variable, Tape B shares decline by approximately one unit. The relationship, while statistically clear, is far from deterministic, as evidenced by the considerable scatter throughout the plot.
Correlation Strength and Statistical Framing The Pearson correlation of r = -0.5451 indicates a moderate negative association. However, the coefficient of determination r² = 0.2971 is the more sobering figure — it tells us that oil prices explain only about 29.7% of the variance in Tape B volume, meaning roughly 70% of the variation remains unexplained by this relationship alone. The 95% confidence interval of [-0.6266, -0.4517] is meaningfully narrow and does not cross zero, lending confidence to the direction and approximate magnitude of the effect. The p-value of effectively 0 (given N = 3,622) confirms this is not a chance finding at any conventional significance threshold. Critically, however, the Granger causality tests show no significant predictive directionality in either direction (X→Y: F = 0.79, p = 0.38; Y→X: F = 1.31, p = 0.25), meaning that neither variable's past values reliably predict the other's future values at a 1-period lag. This is an important caveat: the correlation is real, but it does not reflect a temporally predictive or mechanistic relationship at this resolution.
Notable Patterns, Clusters, and Outliers Several structural features stand out in the data. There is a dense cluster of points congregating around oil prices of roughly $80M–$110M (X-axis range) and Tape B volumes of approximately 40–52 units, forming the core of the distribution. Outside this cluster, a handful of notable outliers pull the regression line: points at very high X values (~$170M–$209M) paired with very low Y values (~26–28) exert substantial leverage on the negative slope. The point at approximately (209M, 26.01) and (170M, 27.59) are particularly influential. At the lower X end, there are instances of moderate-to-high volume (~47–54), consistent with the inverse trend. Additionally, there appears to be a slight funnel or heteroscedastic pattern, with greater variance in Y at lower X values, suggesting the relationship may not be uniformly linear across the full range.
Confounding Factors and Caveats Several important caveats apply before drawing causal conclusions. First, both variables are likely driven by shared macroeconomic conditions in 2016 — a year marked by oil price recovery from multi-year lows, Brexit, and U.S. election uncertainty — which could simultaneously suppress oil prices and elevate equity market volatility and trading volume. Second, the dataset covers only a single calendar year (2016), limiting the generalizability of findings; the correlation structure may look entirely different in other market regimes. Third, the Tape B designation (covering NYSE American, NYSE Arca, and regional exchanges) may respond to sector-specific dynamics (e.g., energy sector listings) that create a spurious correlation with oil prices independent of any real causal mechanism. Fourth, the X-axis variable labeling appears swapped between datasets in the metadata (the Brent price column is listed under Cboe data and vice versa), warranting a data integrity check before publication.
Actionable Insights and Further Investigation Despite the lack of Granger causality, the moderate correlation warrants further investigation as a potential risk indicator or regime signal rather than a predictive tool. Analysts should consider: (1) extending the time series beyond 2016 to test whether the r = -0.55 relationship holds across different oil price regimes (e.g., 2020 negative oil prices, 2022 spikes); (2) controlling for VIX or broader market volatility as a confound, since both oil price swings and elevated trading volumes often co-occur with market stress; (3) testing non-linear specifications (e.g., piecewise regression or polynomial fits) given the apparent heteroscedasticity and the outsized influence of extreme X values; and (4) verifying the axis/dataset mapping in the source metadata, as the column-to-dataset assignment appears reversed, which could fundamentally alter interpretation if confirmed.
X dataset: Cboe U.S. Equities Historical Market Volume Data 2016
Y dataset: Europe Brent Spot Price FOB Daily
Part of experiment: Daily - Cboe U.S. Equities Historical Market Volume Data 2016 vs Europe Brent Spot Price FOB Daily