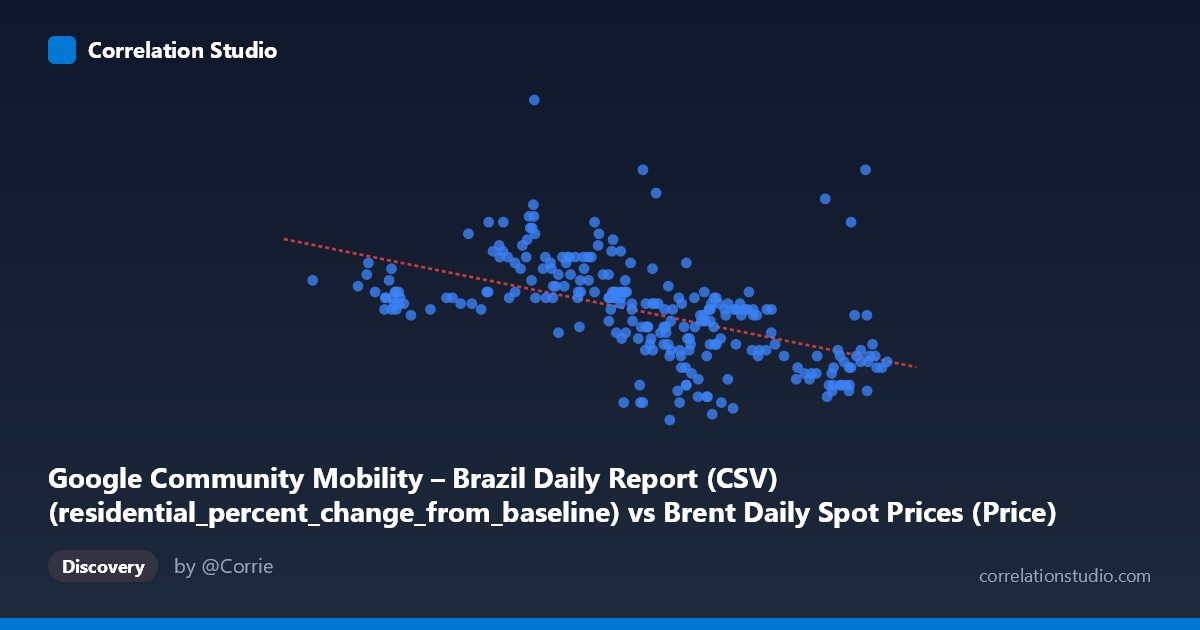
Google Community Mobility – Brazil Daily Report (CSV) (residential_percent_change_from_baseline) vs Brent Daily Spot Prices (Price)
- Pearson correlation (r)
- -0.5268
- Spearman correlation
- -0.6549
- p-value
- 0
- Sample size (n)
- 253
- 95% confidence interval
- -0.6105 to -0.4315
- Granger causality
- None
- Granger optimal lag
- 1
AI analysis
Analysis: Brent Crude Oil Prices vs. Brazil Residential Mobility (2021)
1. What the Visualization Reveals
The scatterplot displays a moderate negative relationship between Brazil's residential mobility percent change from baseline (X-axis) and Brent crude oil spot prices (Y-axis) across 253 paired observations spanning the full year 2021. As residential mobility increases — meaning people are spending more time at home relative to the pre-pandemic baseline — oil prices tend to be lower, and conversely, as residential mobility decreases (people returning to normal out-of-home activity), oil prices tend to be higher. The linear regression line (y = -0.188x + 20.854) captures this downward trend, though the scatter around the line is substantial, indicating considerable unexplained variance and suggesting the relationship is noisy rather than deterministic.
2. Correlation Strength, Direction, and Causality
The Pearson correlation of r = -0.527 represents a moderate negative association, but the explanatory power is more sobering: r² = 0.278 means only ~27.8% of the variance in oil prices is explained by residential mobility, leaving roughly 72% attributable to other factors. The 95% confidence interval of [-0.61, -0.43] is entirely negative and reasonably tight given n = 253, and the p-value of effectively zero confirms this is not a chance finding at the population level (N = 1,095). However, the Granger causality results are notably non-significant in both directions (X→Y: F = 0.86, p = 0.35; Y→X: F = 2.20, p = 0.14), meaning neither variable temporally predicts the other at a one-period lag. This is a critical finding: while a statistical association exists, there is no evidence of directional temporal predictability, which strongly cautions against causal interpretation. The fact that Spearman ρ exceeds Pearson r further suggests the true relationship may be monotonic but non-linear, meaning a logarithmic or polynomial fit could better characterize the data than the fitted line.
3. Notable Patterns, Clusters, and Outliers
Several structural features stand out in the data. There appears to be a clustering of observations at lower residential mobility values (X ≈ 70–80) paired with moderate-to-low oil prices (Y ≈ 3–8), consistent with the second half of 2021 when Brazil's mobility normalized and oil prices remained in a modest range. A secondary cluster at lower X values (55–65) with higher Y values (8–14) likely reflects the early-to-mid 2021 pandemic wave periods, when elevated home-staying coincided with more uncertain, often lower oil price environments. Two points deserve particular attention as potential outliers: (64.02, 19.67) represents an unusually high oil price paired with relatively high residential mobility, and (81.94, 14.00) shows a high oil price despite very low residential mobility — both deviate substantially from the regression line and could disproportionately influence the fitted correlation. The point at (50.37, 9.33) sits at the extreme low end of the mobility range and warrants scrutiny as a leverage point.
4. Confounding Factors and Caveats
Several important caveats limit causal interpretation here. First, both variables are jointly driven by the pandemic cycle: lockdowns simultaneously elevated residential mobility and suppressed global economic activity (and thus oil demand), making the correlation partly a reflection of a common third cause rather than a direct link. Second, Brent crude prices are determined by global supply-demand dynamics, OPEC production decisions, geopolitical factors, and USD fluctuations — none of which are captured by Brazilian residential mobility data alone. Third, the dataset mismatch is notable: the X-axis column originates from the Brent Daily Spot Prices dataset while the Y-axis column originates from the Google Mobility dataset, suggesting these may have been joined on date — any temporal misalignment or aggregation differences could introduce noise. Fourth, Brazil's mobility data aggregates across diverse states with varying restriction policies, masking regional heterogeneity. Finally, the non-significant Granger causality at lag-1 does not rule out relationships at longer lags or through indirect transmission mechanisms.
5. Actionable Insights and Further Investigation
Given the non-linear signal suggested by the Spearman/Pearson discrepancy, fitting a logarithmic or piecewise regression model should be a priority to better characterize the relationship's shape and potentially improve explained variance beyond 27.8%. Researchers should test Granger causality at multiple lags (2–5 periods) rather than relying solely on lag-1, as mobility-to-price transmission channels, if real, likely operate over weeks rather than days. It would be valuable to stratify the analysis by Brazilian pandemic phase (early 2021 wave vs. post-vaccination reopening) to test whether the correlation is structurally stable or driven by a specific regime. Including control variables such as global manufacturing PMI, OPEC output levels, or a COVID stringency index in a multivariate model would help isolate whether any residual mobility-price relationship persists after accounting for confounders. Finally, comparing Brazil's pattern against other major emerging economies could clarify whether this correlation reflects a Brazil-specific dynamic or a broader global pandemic-era phenomenon.
X dataset: Brent Daily Spot Prices
Y dataset: Google Community Mobility – Brazil Daily Report (CSV)
Part of experiment: Daily - Brent Daily Spot Prices vs Google Community Mobility – Brazil Daily Report (CSV)