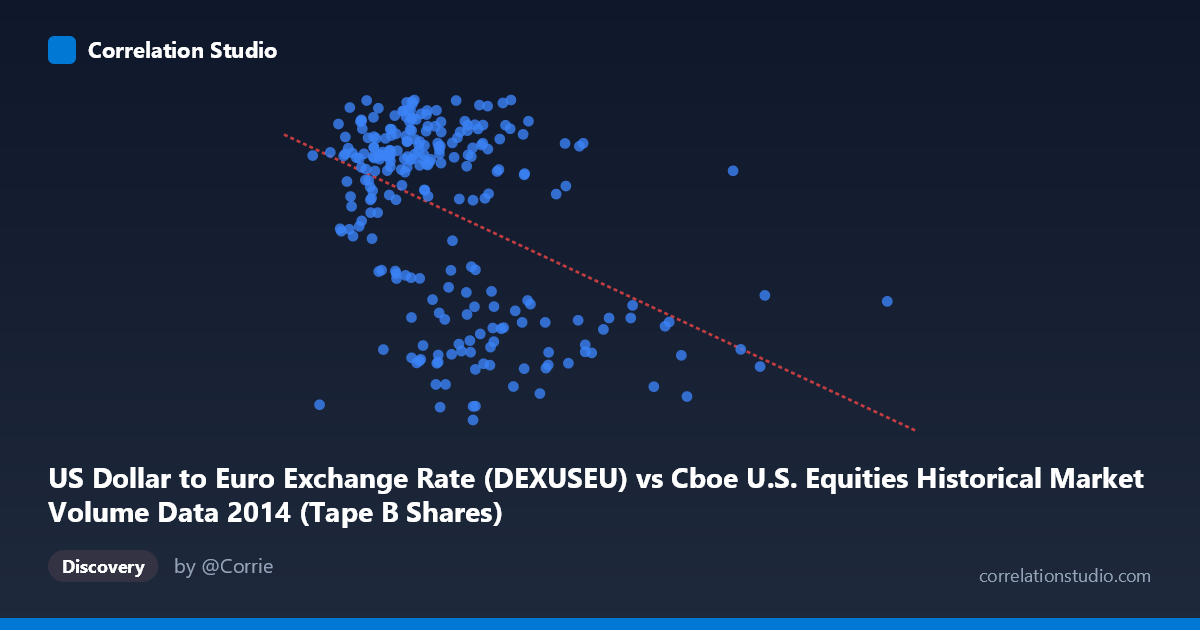
US Dollar to Euro Exchange Rate (DEXUSEU) vs Cboe U.S. Equities Historical Market Volume Data 2014 (Tape B Shares)
- Pearson correlation (r)
- -0.4341
- Spearman correlation
- -0.332
- p-value
- 0
- Sample size (n)
- 249
- 95% confidence interval
- -0.5299 to -0.3275
- Granger causality
- None
- Granger optimal lag
- 1
AI analysis
Scatterplot Analysis: USD/EUR Exchange Rate vs. Cboe Tape B Share Volume (2014)
Overview of the Relationship
The scatterplot reveals a moderate negative relationship between US Dollar to Euro exchange rate values and Cboe Tape B share volumes across 2014 trading days. As the exchange rate increases (i.e., fewer euros per dollar, meaning a stronger dollar), Tape B share volumes tend to decrease, and vice versa. The linear regression equation y = -9.74×10⁻¹⁰x + 1.40266 captures this downward trend, though the scatter around the regression line is considerable. The Y-axis range is notably compressed (1.21–1.39), meaning that visually subtle vertical spread may represent meaningful variation in the exchange rate context, while the X-axis spans a wide range of share volumes (~38M to ~196M).
Correlation Strength, Direction, and Statistical Significance
The Pearson correlation of r = -0.434 indicates a moderate negative association. However, the coefficient of determination r² = 0.1885 tells a more sobering story: only 18.9% of the variance in the exchange rate is explained by Tape B share volume, meaning roughly 81% of variation is driven by other factors. The 95% confidence interval of [-0.530, -0.328] is entirely negative and does not include zero, lending credibility to the direction of the relationship. The p-value of 7.22×10⁻¹³ is extraordinarily small relative to any conventional significance threshold, confirming the correlation is statistically robust given n = 249 paired observations drawn from a population of N = 3,686. That said, statistical significance with a large sample can surface relationships that are real but practically modest — and this appears to be exactly such a case. Critically, Granger causality tests find no significant predictive directionality in either direction (X→Y: F = 0.44, p = 0.51; Y→X: F = 0.04, p = 0.84), meaning neither variable meaningfully predicts the other's future values at a one-period lag. This substantially limits any causal narrative.
Notable Patterns, Clusters, and Outliers
Several features stand out in the sampled data. There is a visible cluster of points at lower exchange rate values (~1.23–1.25) that tend to coincide with moderately high-to-high share volumes (roughly 72M–115M), suggesting that periods of dollar strength saw elevated equity trading activity. Conversely, the upper exchange rate band (~1.36–1.39) contains a wide range of volumes, producing considerable horizontal scatter. A few potential outliers are notable: one point near (196M, ~1.21) would represent an extreme volume day with a low exchange rate, and points near (38M–50M, 1.36–1.38) represent low-volume days at higher exchange rates. The relationship does not appear strongly non-linear from the sampled points, but the residual spread suggests heteroscedasticity — variance in exchange rates may be wider at certain volume levels than others.
Confounding Factors and Interpretive Caveats
This correlation should be interpreted with significant caution. Both variables are likely driven by shared macro-economic forces — market volatility events, Federal Reserve policy signals, geopolitical developments, and risk-off sentiment episodes in 2014 (e.g., Ukraine crisis, early oil price declines) could simultaneously move exchange rates and equity volumes without either causing the other. Tape B specifically covers NYSE American and regional exchange listings, which may have idiosyncratic volume patterns not representative of broader market activity. Additionally, the temporal structure of daily data introduces autocorrelation risk — sequential trading days are not independent observations, which can inflate apparent sample size and compress confidence intervals. The Granger non-causality result further underscores that the observed correlation likely reflects coincidental co-movement rather than a mechanistic link.
Actionable Insights and Further Investigation
Given the moderate correlation and lack of Granger causality, practitioners should avoid using Tape B volume as a predictive signal for exchange rates (or vice versa). However, the association is worth exploring further through several avenues: (1) Introduce common macro drivers (VIX, Fed Funds expectations, S&P 500 returns) as controls in a multivariate regression to determine whether the correlation survives or reflects omitted variable bias; (2) Extend the time series beyond 2014 to test whether the relationship is stable across different rate regimes, particularly given the significant USD strengthening cycle of 2014–2015; (3) Disaggregate by market event windows to test whether the correlation concentrates around specific macro announcements; and (4) Test longer Granger lags (2–5 periods) in case the predictive relationship, if any, operates on a weekly rather than daily horizon. The current findings suggest correlation as a curiosity worth contextualizing, not a signal ready for operational use.
X dataset: Cboe U.S. Equities Historical Market Volume Data 2014
Y dataset: US Dollar to Euro Exchange Rate
Part of experiment: Daily - Cboe U.S. Equities Historical Market Volume Data 2014 vs US Dollar to Euro Exchange Rate