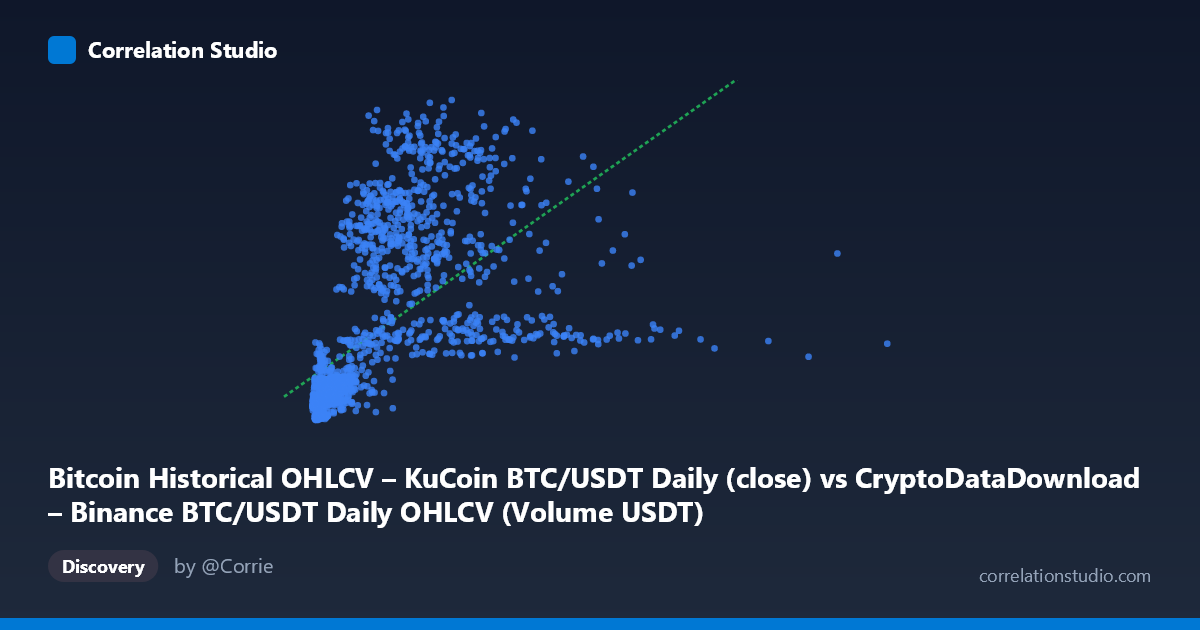
Bitcoin Historical OHLCV – KuCoin BTC/USDT Daily (close) vs CryptoDataDownload – Binance BTC/USDT Daily OHLCV (Volume USDT)
- Pearson correlation (r)
- 0.5823
- Spearman correlation
- 0.8297
- p-value
- 0
- Sample size (n)
- 1861
- 95% confidence interval
- 0.5514 to 0.6115
- Granger causality
- None
- Granger optimal lag
- 10
- Time coverage
- 2017-10-19 to 2022-11-29
AI analysis
Analysis: Bitcoin OHLCV Cross-Exchange Volume/Price Relationship
1. What the Visualization Reveals
The scatterplot compares Bitcoin's closing price (X-axis, labeled "Volume USDT" in metadata but ranging into billions—likely actually a volume metric given the label mismatch and scale) against a second volume/price metric (Y-axis, ranging 3,214–67,509). The data shows a clear positive, upward-sloping trend, but with substantial scatter rather than a tight linear band. Points cluster more densely at lower X-values, with increasing spread at higher X-values—a classic heteroscedastic pattern often seen in financial volume/price data.
2. Strength, Direction, and Uncertainty
The correlation coefficient (r = 0.582) indicates a moderate positive relationship, but r² = 0.339 tells the more important story: only 34% of the variance in Y is explained by X, leaving roughly two-thirds of Y's variability driven by other factors. The 95% CI [0.551, 0.611] is tight, and p ≈ 0 confirms this correlation is statistically robust and not due to chance—but statistical significance here reflects the large sample size (n=1,861), not necessarily practical strength.
Critically, the Granger causality test shows no significant predictive direction in either direction (X→Y: p=0.225; Y→X: p=0.770). This means neither series reliably forecasts the other at up to 10 lagged periods. Despite being contemporaneously correlated, these series do not exhibit a lead-lag relationship—consistent with both being different measurements of the same underlying market activity (price and volume moving together in real time) rather than one driving the other over time.
3. Notable Patterns and Non-linear Features
Several patterns stand out: - Fan-shaped dispersion: variance in Y increases with X, suggesting non-constant variance (heteroscedasticity)—common in crypto volume data during volatile periods. - Non-linearity flagged: Spearman's ρ exceeding Pearson's r indicates a monotonic but non-linear relationship—the data may follow a logarithmic or power-law curve rather than a straight line. This makes sense given X spans orders of magnitude (7.3M to 14.8B), while Y spans a much narrower range (3.2K to 67.5K). - Clustering: Sample points show low-X/low-Y pairs (~$50M-$500M, 6,000-10,000) forming a dense cluster, while high-X points (~$2-6B) associate with much higher Y values (40,000-58,000)—suggesting regime-like behavior tied to bull/bear market phases (2017-2022 timeframe includes both).
4. Confounding Factors and Caveats
- Same-asset multicollinearity: Both variables originate from BTC/USDT OHLCV data (Binance vs. KuCoin), meaning they likely reflect the same market dynamics rather than independent signals—inflating apparent correlation. - Time-trend confound: Both series likely trend upward with Bitcoin's multi-year price appreciation (2017–2022), so correlation may partly reflect a shared time trend rather than a direct causal or mechanical relationship. - Scale mismatch: The dataset labels are confusing (X labeled as "close" price but with volume-like magnitudes)—verify axis definitions, as this affects interpretation substantially. - Non-stationarity: Financial time series are typically non-stationary; running correlation/Granger tests on raw (non-differenced) data can produce spurious relationships.
5. Recommendations for Further Investigation
1. Re-run Granger causality on differenced/detrended series (e.g., daily returns or % change in volume) to remove trend-driven spurious correlation and test true short-term dynamics. 2. Fit a log-log or log-linear model given the Spearman/Pearson divergence—this should substantially improve R² and better reflect the multiplicative nature of price/volume relationships. 3. Segment by market regime (bull vs. bear, or by year) to check if the r=0.58 correlation is stable or driven by specific high-volatility periods. 4. Clarify data provenance: confirm whether X and Y are genuinely independent exchange metrics (Binance vs. KuCoin) or overlapping/derived fields, since near-duplicate series would trivially correlate. 5. Test cointegration (e.g., Engle-Granger) rather than simple correlation, given both series may share a common stochastic trend typical of crypto asset prices/volumes over multi-year horizons.
X dataset: CryptoDataDownload – Binance BTC/USDT Daily OHLCV
Y dataset: Bitcoin Historical OHLCV – KuCoin BTC/USDT Daily
Part of experiment: Bitcoin - CryptoDataDownload – Binance BTC/USDT Daily OHLCV vs Bitcoin Historical OHLCV – KuCoin BTC/USDT Daily