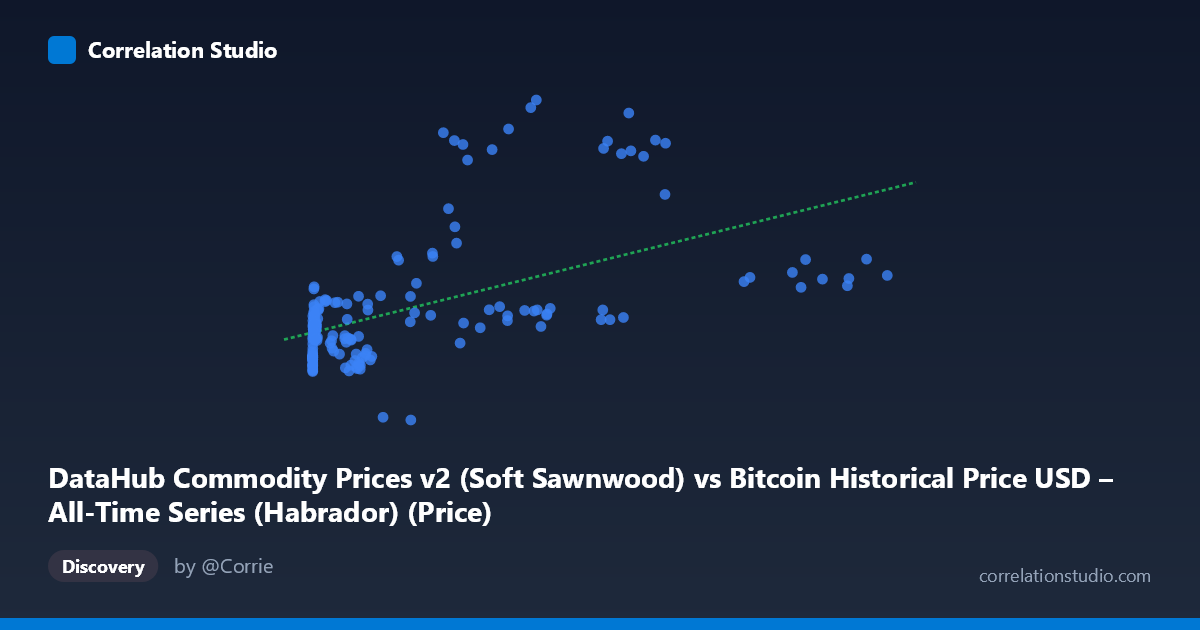
DataHub Commodity Prices v2 (Soft Sawnwood) vs Bitcoin Historical Price USD – All-Time Series (Habrador) (Price)
- Pearson correlation (r)
- 0.5466
- Spearman correlation
- 0.6021
- p-value
- 0
- Sample size (n)
- 182
- 95% confidence interval
- 0.4358 to 0.6411
- Granger causality
- None
- Granger optimal lag
- 10
- Time coverage
- 2010-08-01 to 2025-09-01
AI analysis
Analysis: Bitcoin Price vs. Soft Sawnwood Commodity Price
1. What the Visualization Reveals
The scatterplot shows a moderate positive relationship between Bitcoin's historical USD price (X-axis, spanning a massive range from $0.06 to $113,500) and soft sawnwood commodity prices (Y-axis, ranging $1,313–$10,281). The data is heavily right-skewed on the X-axis — the vast majority of points cluster at low Bitcoin prices (under $50,000), with only a handful of high-value observations near the $100,000+ range. This clustering pattern, combined with the fitted regression line (y = 0.0353x + 3767), suggests that most of the apparent trend is being driven by a relatively small number of high-X observations pulling the slope upward.
2. Strength, Direction, and Statistical Confidence
The correlation coefficient (r = 0.547) indicates a moderate positive linear relationship, with r² = 0.299 meaning only about 30% of the variance in sawnwood prices is explained by Bitcoin price — leaving 70% attributable to other factors. The 95% CI [0.436, 0.641] is reasonably tight and excludes zero, and the p-value (1.33E-15) is highly significant, confirming this correlation is not due to chance. However, statistical significance with a modest r² is a classic case where "significant" does not mean "strong" or "practically dominant" — it means we're confident a real but modest association exists.
Critically, the Granger causality tests show no significant predictive direction in either direction (X→Y: p=0.385; Y→X: p=0.471). This is an important caveat: despite the contemporaneous correlation, neither variable helps forecast the other over time at the optimal lag of 10 periods. This strongly suggests the relationship is not causal in a temporal-predictive sense — it may instead reflect a shared external driver (e.g., both series responding to macroeconomic conditions, inflation, or general USD-denominated asset trends) rather than one market leading the other.
3. Notable Patterns and Outliers
Several data points stand out: at Bitcoin prices around $23,000–$38,000, sawnwood prices spike dramatically (e.g., 27,983 → 9,145; 25,800 → 9,364; 30,590 → 8,599; 38,688 → 9,468), creating a distinct upper cluster well above the regression line. This looks like a specific temporal episode — plausibly reflecting the 2020–2021 period of simultaneous pandemic-driven lumber price spikes and Bitcoin's bull run — rather than a general functional relationship. Outside this cluster, at both very low and very high Bitcoin prices, sawnwood prices are comparatively contained (mostly $2,700–$5,800), suggesting the relationship is not consistent across the full range and may be episodic rather than structural.
4. Confounding Factors and Caveats
This pairing is inherently unusual: Bitcoin price and softwood lumber commodity prices have no obvious direct economic linkage (unlike, say, Bitcoin vs. mining energy costs). Both series are time-indexed (2010–2025) and likely share exposure to common macro factors — USD inflation/deflation, pandemic-era supply chain disruptions, near-zero interest rate environments, and broad speculative asset booms (2020–2021) — that could produce spurious correlation without any genuine mechanistic link. The extreme skew in Bitcoin's price (mean $17,943, stdev $27,080, with values spanning 6 orders of magnitude) means the correlation is highly sensitive to a few high-leverage points, and a log-transform of X would likely be more appropriate for any serious modeling.
5. Suggestions for Further Investigation
Given the lack of Granger causality, this correlation should not be used for forecasting one series from the other. Recommended next steps: (1) re-run the analysis on log(Bitcoin price) to reduce leverage effects and test robustness of r²; (2) isolate and examine the 2020–2021 subperiod separately, since it appears to be driving the correlation via a shared macro shock; (3) introduce candidate confounders (e.g., CPI, M2 money supply, or a general commodity index) into a multivariate model to test whether the Bitcoin–sawnwood link disappears once common drivers are controlled for; and (4) treat this relationship as likely spurious/co-incidental unless a plausible economic mechanism connecting cryptocurrency and lumber markets can be established.
X dataset: Bitcoin Historical Price USD – All-Time Series (Habrador)
Y dataset: DataHub Commodity Prices v2
Part of experiment: Bitcoin - Bitcoin Historical Price USD – All-Time Series (Habrador) vs DataHub Commodity Prices v2