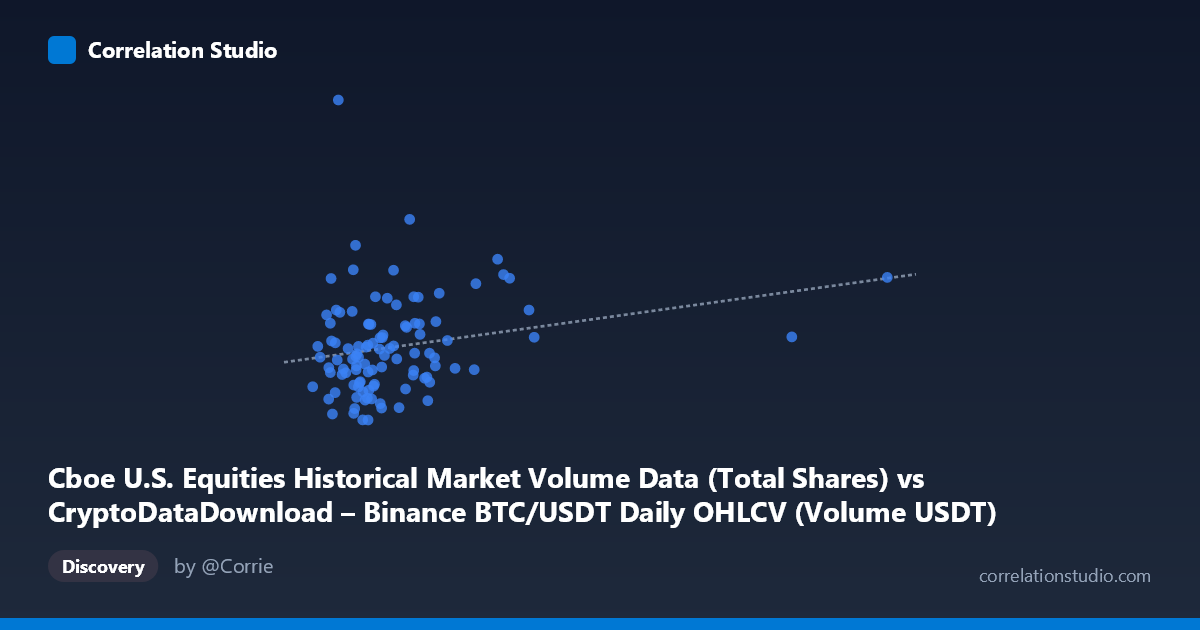
Cboe U.S. Equities Historical Market Volume Data (Total Shares) vs CryptoDataDownload – Binance BTC/USDT Daily OHLCV (Volume USDT)
- Pearson correlation (r)
- 0.2269
- Spearman correlation
- 0.242
- p-value
- 0.020552
- Sample size (n)
- 104
- 95% confidence interval
- 0.0359 to 0.4019
- Granger causality
- None
- Granger optimal lag
- 10
- Time coverage
- 2026-01-02 to 2026-06-25
- Recomputed on refreshed data
- 2026-10-23 (r was 0.2269)
AI analysis
Correlation Analysis: Cboe Equities Volume vs. Binance BTC/USDT Volume
1. Relationship Overview The scatterplot depicts a modest positive association between two ostensibly unrelated market metrics: Cboe U.S. equities share volume (X-axis) and Binance BTC/USDT trading volume in USDT (Y-axis). The data cloud shows a loose upward trend, but with substantial scatter throughout — most points cluster tightly in the lower-left region (X between ~800M–2.5B, Y between ~800M–1.2B), while a handful of high-X outliers (notably the 6.1B and 7.2B points) extend the range considerably without proportionally elevating Y. This suggests the relationship, while statistically detectable, is far from deterministic.
2. Strength, Direction, and Statistical Confidence The Pearson correlation of r = 0.44 indicates a weak-to-moderate positive linear relationship. Critically, r² = 0.194 means only about 19% of the variance in Binance volume is explained by Cboe equity volume — leaving over 80% attributable to other factors. The 95% CI [0.257, 0.594] is reasonably wide but excludes zero, and the p-value (1.38E-05) confirms this correlation is statistically significant and unlikely due to chance in this sample. However, statistical significance here reflects sample size and effect reliability, not practical strength — a weak correlation can still be "significant." Most tellingly, the Granger causality tests show no predictive direction in either direction (X→Y: p=0.80; Y→X: p=0.68). This means neither market's volume history helps forecast the other's future volume at the tested lag structure — the correlation is likely contemporaneous/coincidental (e.g., both responding to shared macro volatility events) rather than a lead-lag causal dynamic.
3. Notable Patterns and Outliers The data shows a dense core cluster with a long right tail in X — a handful of extreme Cboe volume days (2.9B–7.2B) appear to be volume spikes (possibly triple-witching days, index rebalances, or high-volatility equity sessions) that don't correspond to proportionally extreme BTC volume. This creates leverage points that may be inflating the regression slope. The bulk of the relationship — where 80+ of the 90 points reside — shows Y varying between 800M and 1.2B fairly independently of X, suggesting the "trend line" is partly an artifact of a few high-leverage observations rather than a systematic pattern across the whole range.
4. Confounding Factors and Caveats Both series are volume metrics tied to time — meaning both are likely driven by common macro conditions (market-wide volatility spikes, major news events, holidays/low-liquidity days) rather than one causing the other. This is a classic case of spurious correlation via shared temporal confounding: overall "risk-on" trading days or major economic announcements could simultaneously boost volumes in both equities and crypto without any direct mechanistic link. Additionally, n=90 paired days sampled from a population of 1,980 raises questions about how the subsample was selected (every-nth-day sampling can miss clustering/autocorrelation structure in daily financial data). Outliers/leverage points also warrant scrutiny — the extreme Cboe volume days could reflect data artifacts (e.g., quarterly options expiration) rather than organic volume shifts.
5. Recommendations for Further Investigation 1. Test with outliers removed — rerun correlation excluding the 3-4 extreme X points to see if r changes meaningfully; if it drops toward zero, the relationship is not robust. 2. Control for common confounders — introduce a volatility index (VIX) or macro calendar events as covariates to check if the correlation disappears after conditioning. 3. Explore contemporaneous correlation of returns/changes rather than levels, and test at multiple lag structures beyond 10 periods, including lag 0 (same-day) causality. 4. Increase temporal resolution/sample — since the full population is 1,980 points but only 90 were sampled, re-analyzing with the full dataset could tighten the confidence interval and clarify whether the observed r is stable or sample-dependent. 5. Given the lack of Granger causality, avoid using one series as a leading indicator for the other in any predictive trading strategy; the relationship is best treated as coincidental co-movement rather than an actionable signal.
X dataset: CryptoDataDownload – Binance BTC/USDT Daily OHLCV
Y dataset: Cboe U.S. Equities Historical Market Volume Data
Part of experiment: Bitcoin - CryptoDataDownload – Binance BTC/USDT Daily OHLCV vs Cboe U.S. Equities Historical Market Volume Data