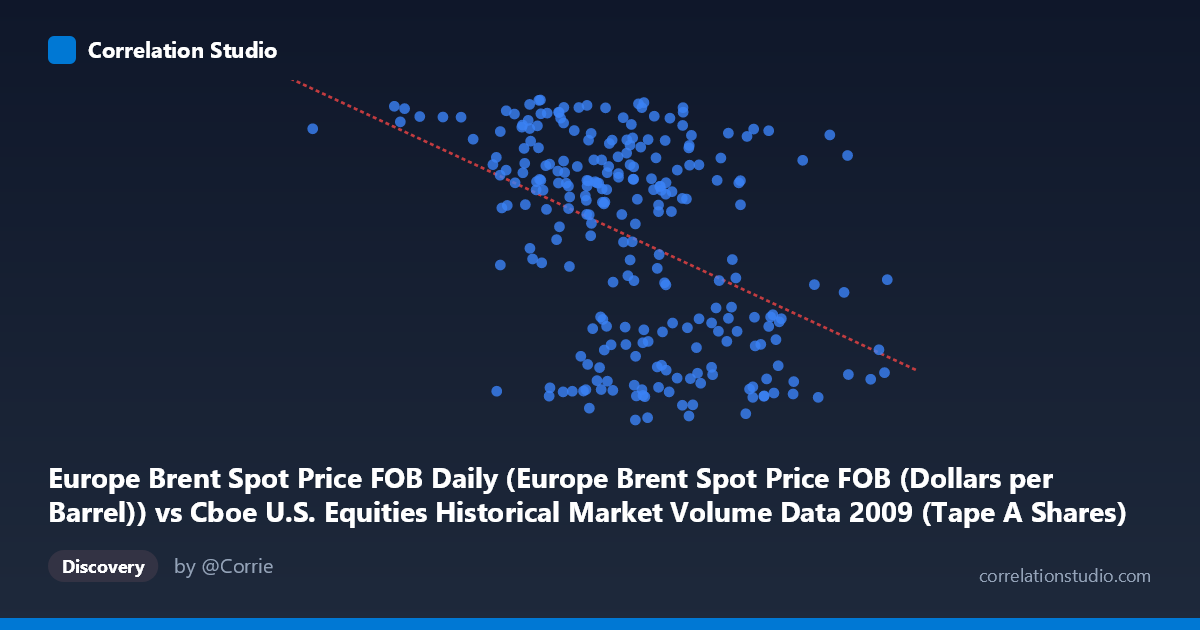
Europe Brent Spot Price FOB Daily (Europe Brent Spot Price FOB (Dollars per Barrel)) vs Cboe U.S. Equities Historical Market Volume Data 2009 (Tape A Shares)
- Pearson correlation (r)
- -0.4352
- Spearman correlation
- -0.4117
- p-value
- 0
- Sample size (n)
- 252
- 95% confidence interval
- -0.5303 to -0.3294
- Granger causality
- None
- Granger optimal lag
- 1
AI analysis
Scatterplot Analysis: Europe Brent Spot Price vs. Cboe U.S. Equities Tape A Shares (2009)
Relationship Overview The scatterplot reveals a moderate negative relationship between Europe Brent crude oil spot prices (X-axis) and Cboe U.S. Equities Tape A share volume (Y-axis) across 252 trading days in 2009. The linear regression equation (y = -5.49×10⁻⁸x + 85.84) indicates that as oil prices rise, equity trading volume in Tape A shares tends to decline. This is a somewhat counterintuitive finding at first glance, but it reflects the broader 2009 market narrative: the year began with extreme post-crisis volatility and depressed oil prices, which corresponded with frenzied trading activity, and as conditions stabilized and oil recovered through the year, "panic-driven" volume subsided. The downward slope is visible in the chart, though substantial scatter around the regression line is immediately apparent.
Correlation Strength, Statistical Significance, and Causality The Pearson correlation of r = -0.4352 reflects a moderate negative association, but the more telling metric is r² = 0.1894 — meaning oil prices explain only ~19% of the variance in Tape A share volume. The remaining ~81% is driven by factors entirely unrelated to crude oil pricing. The 95% confidence interval for r spans [-0.5303, -0.3294], which is meaningfully negative throughout and does not cross zero, lending credibility to the directional finding. The p-value of 4.53×10⁻¹³ is extraordinarily small, confirming the correlation is highly statistically significant and extremely unlikely to be a chance artifact given n = 252. However, statistical significance should not be confused with practical importance — r² of 19% is modest. Critically, Granger causality testing finds no significant predictive direction in either direction: X→Y yields F = 0.14, p = 0.708, and Y→X yields F = 0.0006, p = 0.980. This means neither variable temporally predicts the other at a 1-period lag, strongly cautioning against any causal interpretation of the correlation.
Notable Patterns, Clusters, and Outliers Several structural features stand out in the scatterplot. The data appears to cluster into two loose bands: a higher-volume cluster (Tape A ~65–78 billion shares) concentrated at lower oil price ranges (~105M–450M on the X scale), and a lower-volume cluster (~40–55 billion shares) more prevalent at higher oil price values (~500M–704M). This bimodal-like dispersion hints at regime-switching behavior consistent with the 2009 market timeline — early-year crisis-mode trading followed by a calmer recovery phase. The point at approximately (105.7M, 75.15) stands out as the lowest oil price with relatively high volume, likely reflecting early January 2009 conditions. The point at (704.2M, 56.63) represents the highest oil price observation with moderate volume. There are also notable outliers in the high-volume, mid-oil-price range — e.g., (491.6M, 77.18) and (491.4M, 77.74) — suggesting that even at moderate oil prices, episodic spikes in trading activity occurred, possibly tied to specific market events.
Confounding Factors and Caveats This correlation almost certainly reflects shared temporal dependence on the 2009 market recovery rather than any direct economic link between oil prices and equity exchange volume. Both variables were heavily influenced by the unwinding of the 2008 financial crisis: early 2009 saw low oil prices and high volatility-driven trading; as confidence returned mid-to-late year, oil recovered while trading volume normalized downward. This creates a spurious negative correlation driven by a common third factor — time and market risk sentiment. Additionally, the X and Y axis labels appear to have been swapped in the dataset documentation (Brent price labeled under Cboe data and vice versa), which warrants verification of data alignment. The N = 3,232 population size versus n = 252 sample also suggests subsampling was applied, and results may not be fully representative if sampling was not random across all market conditions.
Actionable Insights and Further Investigation Given the absence of Granger causality and the limited variance explained, practitioners should not use oil price movements as a trading volume predictor in isolation. However, the structural clustering observed warrants further decomposition: splitting the data by quarter or by VIX regime would help determine whether the negative correlation is uniform across 2009 or concentrated in specific periods (likely Q1). Incorporating explicit market volatility measures (VIX), Federal Reserve policy events, and equity index returns as covariates in a multivariate regression would likely absorb much of the apparent oil-volume relationship and reveal it as coincidental. A rolling-window correlation analysis over shorter time horizons could also clarify whether the relationship strengthens during specific stress periods. Finally, examining other Tape categories (B, C) or total market volume would test whether this pattern is specific to Tape A or systemic across U.S. equity markets.
X dataset: Cboe U.S. Equities Historical Market Volume Data 2009
Y dataset: Europe Brent Spot Price FOB Daily
Part of experiment: Daily - Cboe U.S. Equities Historical Market Volume Data 2009 vs Europe Brent Spot Price FOB Daily