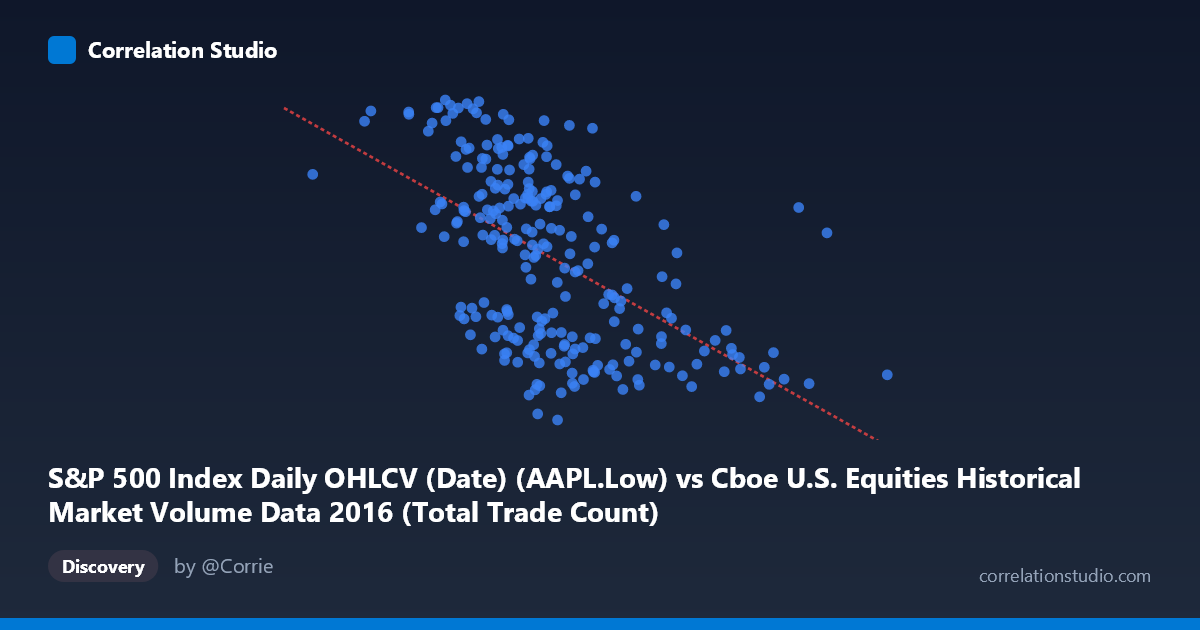
S&P 500 Index Daily OHLCV (Date) (AAPL.Low) vs Cboe U.S. Equities Historical Market Volume Data 2016 (Total Trade Count)
- Pearson correlation (r)
- -0.5433
- Spearman correlation
- -0.5718
- p-value
- 0
- Sample size (n)
- 252
- 95% confidence interval
- -0.6249 to -0.4499
- Granger causality
- None
- Granger optimal lag
- 1
AI analysis
Scatterplot Analysis: AAPL Low Price vs. Cboe Total Trade Count (2016)
Relationship Overview The scatterplot reveals a moderate negative relationship between Apple's daily low price (S&P 500 OHLCV dataset) and the total trade count on Cboe U.S. equity exchanges throughout 2016. As AAPL's low price increases, the total number of trades recorded tends to decrease. The linear regression equation (y = -7.89×10⁻⁶x + 122.79) reflects this inverse slope, suggesting that higher AAPL price levels coincide with periods of reduced overall trading activity. Visually, the data points form a broadly downward-sloping cloud, though with considerable scatter throughout the range, indicating the relationship is real but far from deterministic.
Correlation Strength and Statistical Significance The Pearson correlation of r = -0.5433 indicates a moderate negative association, and with a p-value effectively at zero (p ≈ 0), this result is statistically significant across the full paired sample of n = 252 observations. However, the coefficient of determination r² = 0.2951 is the more practically meaningful figure: AAPL's low price explains only about 29.5% of the variance in total trade count, meaning the majority (~70.5%) of fluctuations in trading activity are driven by other factors entirely. The 95% confidence interval for r of [-0.6249, -0.4499] is reasonably tight and does not cross zero, reinforcing confidence in the direction and approximate magnitude of the relationship. Importantly, Granger causality tests show no significant predictive directionality in either direction (X→Y: F = 0.923, p = 0.338; Y→X: F = 1.312, p = 0.253), meaning that past values of AAPL's low price do not reliably predict future trade counts, and vice versa. This effectively rules out a simple temporal lead-lag mechanism between the two series.
Notable Patterns, Clusters, and Outliers Several structural features are visible in the data. The bulk of observations cluster in the AAPL low-price range of roughly $90–$115, which aligns with AAPL's trading range through most of 2016. Within this core cluster, the scatter is wide, reinforcing the modest r². There appear to be high-trade-count outliers (Y values approaching or exceeding 115–117) that are concentrated at lower AAPL price levels (roughly $90–$100), consistent with early 2016 when AAPL was under pressure and market volatility was elevated. Conversely, at higher AAPL prices (above $110), trade counts tend to compress toward the 95–110 range. A handful of extreme low-Y observations (trade counts near 89–92) span a moderate X range, suggesting occasional low-activity trading days that are not strictly price-dependent.
Confounding Factors and Caveats This correlation warrants careful interpretation for several reasons. First, there is a dataset labeling anomaly worth noting: the axes appear to have swapped dataset origins (AAPL Low is drawn from the Cboe dataset column, and trade count from the S&P OHLCV dataset), which may reflect a data joining artifact and should be verified. Second, both variables are time-indexed to 2016, meaning shared macroeconomic forces — such as the January–February 2016 global equity selloff, Brexit volatility in June, and the post-election rally in November — could simultaneously depress AAPL prices and elevate trade volumes, creating a spurious or partially confounded correlation rather than a causal one. Third, AAPL's price is a single-stock metric while total Cboe trade count is a market-wide aggregate, making it conceptually unusual to correlate them directly without controlling for broader market conditions (e.g., VIX, S&P 500 index level, or total market capitalization).
Actionable Insights and Further Investigation Given these findings, several follow-up analyses are warranted. Partial correlation analysis controlling for VIX or overall S&P 500 returns would help isolate whether AAPL price independently predicts trade activity or whether both are merely co-driven by market-wide volatility regimes. Segmenting the data by quarter or volatility regime could reveal whether the negative relationship is stronger during stress periods (Q1 2016) versus calm periods (Q3 2016). Since Granger causality is absent at lag 1, testing longer lags (2–5 periods) or applying a rolling-window correlation could reveal whether the relationship strengthens or weakens across different market phases. Finally, replacing AAPL Low with a market-wide price index as the X variable would provide a more conceptually coherent test of whether price levels systematically predict aggregate trading activity — a question with genuine market microstructure implications.
X dataset: Cboe U.S. Equities Historical Market Volume Data 2016
Y dataset: S&P 500 Index Daily OHLCV (Date)
Part of experiment: Daily - Cboe U.S. Equities Historical Market Volume Data 2016 vs S&P 500 Index Daily OHLCV (Date)