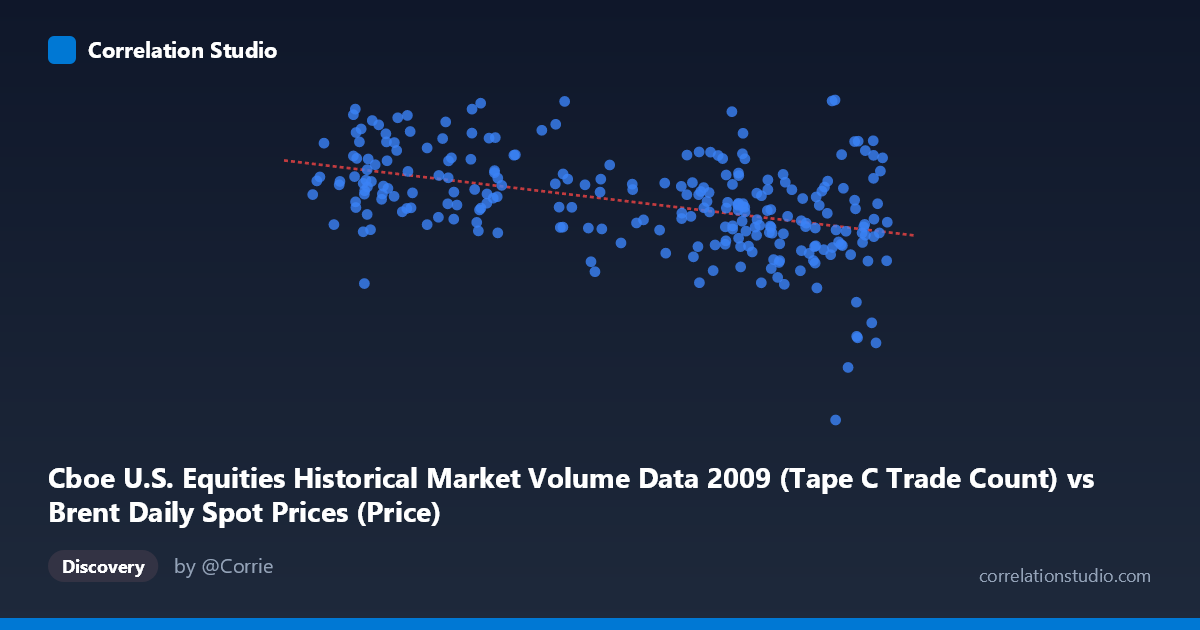
Cboe U.S. Equities Historical Market Volume Data 2009 (Tape C Trade Count) vs Brent Daily Spot Prices (Price)
- Pearson correlation (r)
- -0.445
- Spearman correlation
- -0.4451
- p-value
- 0
- Sample size (n)
- 252
- 95% confidence interval
- -0.539 to -0.3402
- Granger causality
- None
- Granger optimal lag
- 10
AI analysis
Scatterplot Analysis: Cboe Tape C Trade Count vs. Brent Crude Oil Spot Price (2009)
Relationship Overview
The scatterplot reveals a negative relationship between Cboe U.S. Equities Tape C trade count (X) and Brent crude oil spot prices (Y) across 252 trading days in 2009. As equity trade counts increase, Brent crude prices tend to decrease, following the regression line y = -3606.16x + 858,476. This inverse pattern is visually apparent but accompanied by substantial scatter, meaning the linear trend captures only part of the story. The data spans the full 2009 calendar year, a period that encompassed both the tail end of the financial crisis and a significant recovery rally in risk assets, making this a particularly dynamic window for interpreting cross-asset relationships.
Correlation Strength and Statistical Interpretation
The Pearson correlation of r = -0.445 indicates a moderate negative association. However, R² = 0.198 means that trade count explains only about 19.8% of the variance in Brent prices — leaving roughly 80% of price variation unexplained by this variable alone. The 95% confidence interval of [-0.539, -0.340] is entirely negative, confirming directional consistency, and the p-value of 1.16 × 10⁻¹³ is highly significant, ruling out chance given the sample size of 252. That said, statistical significance here is partly a function of the large population context (N = 3,232). Critically, Granger causality tests find no significant predictive directionality in either direction (X→Y: F = 1.34, p = 0.21; Y→X: F = 1.15, p = 0.32), meaning neither variable reliably predicts the other's future values at the optimal 10-period lag. The correlation, while real, appears contemporaneous and non-causal in the temporal sense.
Notable Patterns, Clusters, and Outliers
Several features stand out in the data: - High-Y, low-X cluster: Multiple points in the X range of ~41–55 show Y values exceeding 750,000–830,000, suggesting that periods of lower equity trading activity coincided with elevated oil prices (likely early 2009 when crude was recovering from its 2008 crash lows). - A pronounced outlier at approximately (75.15, 185,887) sits dramatically below the regression line — a high-trade-count day with anomalously low Brent prices, likely corresponding to a specific date in early 2009 when crude was still depressed post-crisis. - Another outlier near (77.62, 387,119) follows a similar high-X, very-low-Y pattern, reinforcing that a small cluster of high-volume equity days coincided with historically low crude prices. - The bulk of the distribution occupies a diagonal band between X = 55–75 and Y = 500,000–750,000, with noticeable vertical spread throughout, consistent with the low R².
Confounding Factors and Caveats
Several important caveats apply. First, 2009 represents an extraordinary macroeconomic period — global recession, financial system stress, and the beginning of a risk asset recovery — meaning the negative correlation may reflect a shared response to a third driver (risk sentiment, economic recovery trajectory) rather than any direct link between equity volumes and oil prices. Second, the Tape C dataset mixes multiple equity venues, so trade count reflects broad market activity rather than any oil-sector-specific trading. Third, temporal dynamics matter: the Granger results suggest the relationship is not lead-lag in nature, which weakens any mechanistic interpretation. Finally, both series likely carry autocorrelation and trend components driven by the macro calendar of 2009 (crisis bottom in March, steady recovery thereafter), which could inflate the apparent cross-variable correlation.
Actionable Insights and Further Investigation
Despite the non-causal finding, the moderate negative correlation warrants further examination. Analysts should consider controlling for date/time trends (e.g., detrending both series or using differenced returns) to isolate whether any residual correlation persists beyond shared macro momentum. Regime-based segmentation — splitting the data into pre- and post-March 2009 crisis bottom — could reveal whether the correlation is driven by a specific sub-period. Investigating the two prominent low-Y outliers by exact date would clarify whether they represent data anomalies or genuine market events. More broadly, this analysis suggests that equity market activity and crude oil prices respond to common macroeconomic forces in 2009, making a multivariate framework incorporating risk indices (e.g., VIX), dollar strength, or economic surprise data far more appropriate for modeling either variable.
X dataset: Brent Daily Spot Prices
Y dataset: Cboe U.S. Equities Historical Market Volume Data 2009
Part of experiment: Daily - Brent Daily Spot Prices vs Cboe U.S. Equities Historical Market Volume Data 2009