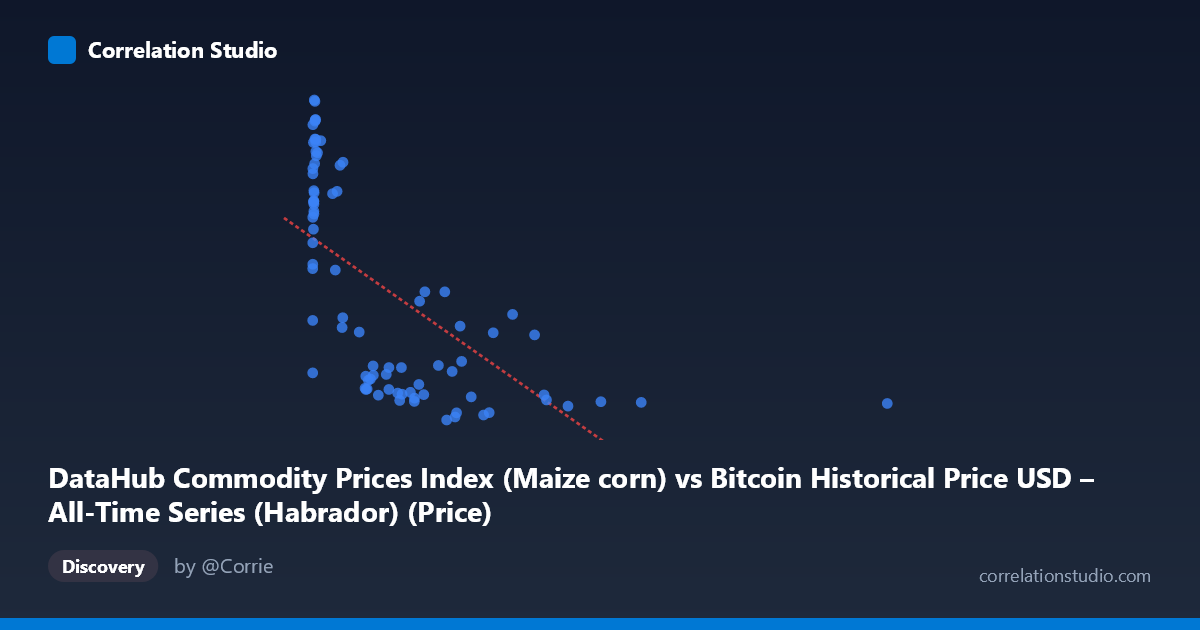
DataHub Commodity Prices Index (Maize corn) vs Bitcoin Historical Price USD – All-Time Series (Habrador) (Price)
- Pearson correlation (r)
- -0.6323
- Spearman correlation
- -0.7271
- p-value
- 0
- Sample size (n)
- 83
- 95% confidence interval
- -0.7462 to -0.4824
- Granger causality
- None
- Granger optimal lag
- 10
AI analysis
Analysis: Maize Corn Index vs. Bitcoin Price
1. Relationship Overview
The scatterplot reveals a non-linear, inverse relationship between the maize/corn commodity index (X) and Bitcoin price (Y). Rather than a clean linear decay, the data shows a distinctive pattern: a dense cluster of high-Y values (~250-330) concentrated at very low X values (near 0), followed by a rapid drop-off and long tail of low-Y values (~150-220) stretching across a wide range of X values (up to 2452). This shape is characteristic of a power-law or exponential decay curve rather than a true linear trend.
2. Strength, Direction, and Statistical Confidence
The Pearson correlation of r = -0.632 indicates a moderate-to-strong negative linear association, with r² = 0.40 meaning only 40% of the variance in Bitcoin price is explained by the linear fit with corn prices — leaving 60% unexplained by this relationship alone. The 95% CI [-0.746, -0.482] is reasonably tight and excludes zero, and the p-value (1.44E-10) confirms this correlation is highly unlikely due to chance. However, statistical significance does not imply practical predictive strength here — the Granger causality tests show no significant temporal causality in either direction (X→Y: p=0.294; Y→X: p=0.119), meaning past values of one series do not meaningfully help forecast future values of the other. This strongly suggests the correlation is not causal but likely driven by a shared underlying factor — most plausibly the passage of time itself.
3. Notable Patterns and Outliers
Several features stand out: - Bimodal clustering: One dense cluster sits at X < 50, Y 260 (early period), while a second cluster spans X = 200-1000, Y = 150-220. - Sparse high-X tail: Points like (2452.18, 157.96) and (1402.08, 158.59) are isolated at extreme X values with low, stable Y — suggesting Bitcoin price plateaus while the index climbs. - Mid-range outliers: Points like (456.27, 216.92), (478.72, 222.36), and (563.74, 222.33) deviate upward from the general downward trend, indicating volatility clusters (likely bull-run periods). - The curve shape suggests a logarithmic or inverse relationship would fit better than a straight line.
4. Confounding Factors and Caveats
This is almost certainly a spurious correlation driven by time-trend confounding. Bitcoin price and a commodity index are both time series (2010-2017); Bitcoin exhibits explosive, non-stationary growth over this period, while the corn index follows its own independent macroeconomic trajectory. Any two trending series can show artificial correlation without genuine economic linkage. Additionally, n=83 sampled from N=449 — the sampling method and potential uneven time-spacing could distort the true relationship. There's no clear economic mechanism connecting corn prices to Bitcoin valuation.
5. Recommendations
- Detrend both series (e.g., difference or log-transform) before correlating, to remove shared time-trend effects and reveal any genuine relationship. - Test a non-linear model (log-log or exponential fit) given the curve shape — linear r² likely understates or misrepresents the true functional form. - Treat this correlation as non-causal given the Granger results; avoid using corn prices as a Bitcoin price predictor. - Investigate whether a third variable (e.g., USD strength, global risk sentiment, or simple calendar time) better explains both series' movements.
X dataset: Bitcoin Historical Price USD – All-Time Series (Habrador)
Y dataset: DataHub Commodity Prices Index
Part of experiment: Bitcoin - Bitcoin Historical Price USD – All-Time Series (Habrador) vs DataHub Commodity Prices Index