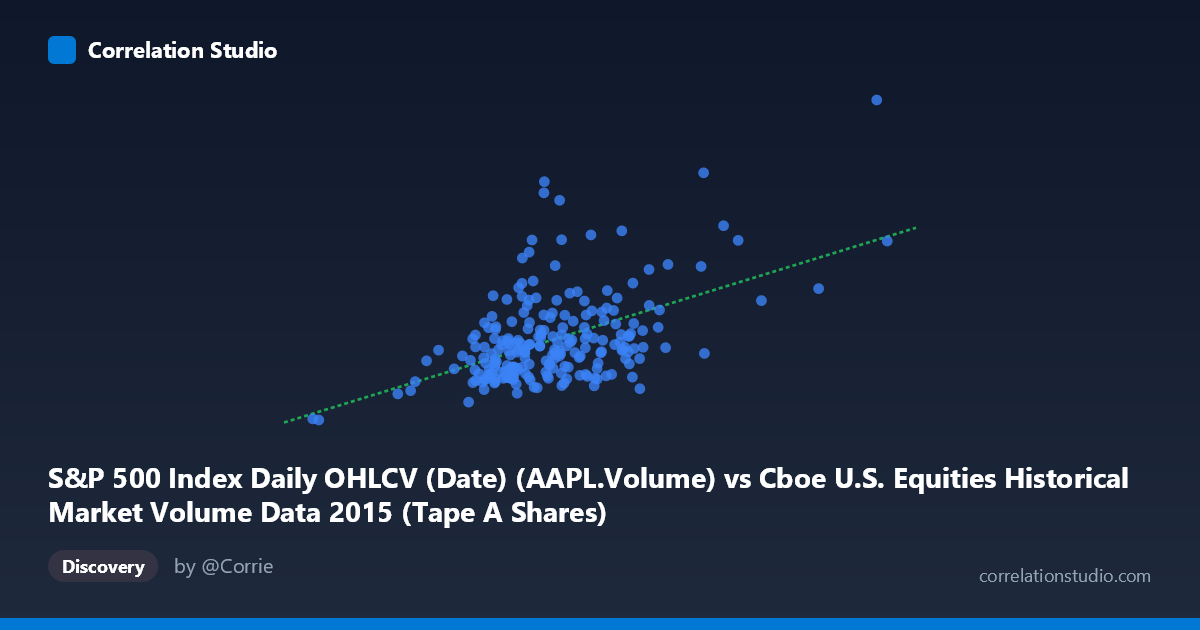
S&P 500 Index Daily OHLCV (Date) (AAPL.Volume) vs Cboe U.S. Equities Historical Market Volume Data 2015 (Tape A Shares)
- Pearson correlation (r)
- 0.5054
- Spearman correlation
- 0.407
- p-value
- 0
- Sample size (n)
- 222
- 95% confidence interval
- 0.4003 to 0.5973
- Granger causality
- None
- Granger optimal lag
- 10
AI analysis
Scatterplot Analysis: AAPL Trading Volume vs. Cboe Tape A Shares (2015)
Relationship Overview The scatterplot reveals a positive, moderately weak linear relationship between Apple's daily trading volume (S&P 500 OHLCV dataset) on the X-axis and Cboe U.S. Equities Tape A share volume on the Y-axis across 222 paired observations spanning February through December 2015. The linear regression equation (y = 0.2017x − 5.91M) suggests that for every additional unit of AAPL volume, Tape A shares increase by roughly 0.20 units — a modest slope indicating that while the variables move together directionally, AAPL volume is only one of many forces driving broad market activity. The data points form a loosely dispersed cloud concentrated in the lower-middle range of both axes, with notable scatter throughout, reflecting considerable noise around the central trend.
Correlation Strength and Statistical Significance The Pearson correlation of r = 0.505 indicates a moderate positive association, but the more informative metric is r² = 0.255, meaning AAPL's daily trading volume explains only about 25.5% of the variance in Tape A share volume — leaving roughly three-quarters of variation attributable to other factors entirely. The 95% confidence interval [0.400, 0.597] is reasonably tight and does not cross zero, and the p-value of 8.88 × 10⁻¹⁶ confirms the relationship is highly statistically significant and almost certainly not a chance artifact given n = 222. However, statistical significance here should not be conflated with practical predictive power; the wide residual scatter makes precise point predictions unreliable. Critically, Granger causality tests find no significant temporal predictive direction in either direction (X→Y: F = 1.38, p = 0.19; Y→X: F = 0.85, p = 0.58 at optimal lag 10), meaning neither variable meaningfully leads or predicts the other across time — the correlation is likely contemporaneous and driven by shared external market conditions rather than any causal mechanism.
Notable Patterns, Clusters, and Outliers The bulk of observations cluster tightly between approximately 230M–310M on the X-axis and 30M–70M on the Y-axis, forming a dense core suggesting relatively stable co-movement during normal market conditions. However, several prominent outliers distort the picture significantly: one extreme point near (510M AAPL volume, 162M Tape A shares) sits far to the upper right and likely corresponds to a high-volatility event such as an earnings release or major market shock. A second cluster of elevated Y-values (Tape A ~100M–125M) at moderate X-values (~270M–400M) suggests episodes where broad market volume surged independently of AAPL's proportional contribution. The point near (113M, 13M) at the lower-left extreme similarly appears isolated, possibly reflecting a low-liquidity holiday-adjacent trading day. These outliers are likely exerting disproportionate leverage on the regression line and inflating the r value.
Confounding Factors and Interpretive Caveats Several important caveats limit interpretation. First, AAPL is itself a component of S&P 500 and a major Tape A constituent, creating an inherent structural relationship — some correlation is essentially definitional rather than informative. Second, both variables are likely driven by the same macroeconomic calendar events (FOMC meetings, earnings seasons, geopolitical volatility events in 2015 such as the August flash crash), meaning shared external drivers are a primary confounder. Third, the dataset axis labels appear swapped in description (X is labeled from the S&P 500 OHLCV dataset while Y from the Cboe dataset), which warrants verification before drawing directional conclusions. Finally, the 2015 sample period includes the August 24th flash crash, a structurally anomalous event that likely accounts for the most extreme outlier and may be skewing the correlation substantially.
Actionable Insights and Further Investigation Practitioners should avoid using AAPL volume as a standalone predictor of Tape A activity given only 25.5% explained variance and failed Granger tests — any trading model or market surveillance tool relying on this link would have severe predictive limitations. Priority next steps should include: (1) removing or flagging the August 2015 flash crash observations and re-running the correlation to isolate structural vs. event-driven relationships; (2) testing a multivariate model incorporating other mega-cap stocks (MSFT, AMZN, GOOG) to assess whether AAPL's explanatory power survives controlling for broader market leadership; (3) segmenting by market regime (low vs. high VIX periods) to test whether the correlation strengthens during stress events; and (4) applying robust regression techniques (e.g., Theil-Sen or Huber regression) to reduce the influence of the identified outliers and obtain more reliable coefficient estimates.
X dataset: Cboe U.S. Equities Historical Market Volume Data 2015
Y dataset: S&P 500 Index Daily OHLCV (Date)
Part of experiment: Daily - Cboe U.S. Equities Historical Market Volume Data 2015 vs S&P 500 Index Daily OHLCV (Date)