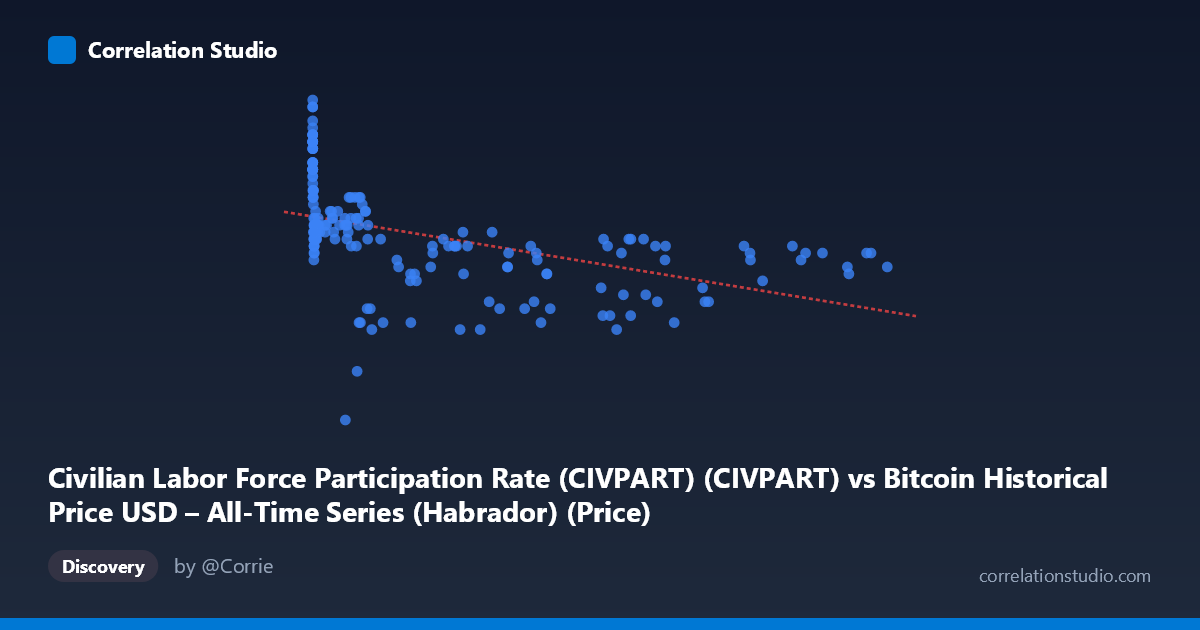
Civilian Labor Force Participation Rate (CIVPART) (CIVPART) vs Bitcoin Historical Price USD – All-Time Series (Habrador) (Price)
- Pearson correlation (r)
- -0.4829
- Spearman correlation
- -0.7824
- p-value
- 0
- Sample size (n)
- 193
- 95% confidence interval
- -0.5843 to -0.3666
- Granger causality
- None
- Granger optimal lag
- 1
- Time coverage
- 2010-08-01 to 2026-09-01
- Recomputed on refreshed data
- 2026-10-24 (r was -0.4476)
AI analysis
Analysis: Bitcoin Price vs. Civilian Labor Force Participation Rate
1. What the Visualization Reveals
The scatterplot shows a modest inverse relationship between Bitcoin's historical price (X-axis, note the mislabeling in the data—X is actually price, Y is CIVPART per the column descriptions) and labor force participation rate. As Bitcoin's price increases, CIVPART tends to drift slightly lower, though the relationship is loose and scattered rather than tight. The data is heavily right-skewed on the X-axis (prices range from $0.06 to $113,500, with mean $20,011 but stdev $29,101), meaning most observations cluster at low price points with a long tail of high-price outliers from Bitcoin's bull-run periods.
2. Strength, Direction, and Statistical Confidence
The correlation coefficient (r = -0.4476) indicates a weak-to-moderate negative relationship. The r² of 0.2003 means only about 20% of the variance in CIVPART is statistically associated with Bitcoin price movements—leaving 80% unexplained by this relationship alone. The 95% CI [-0.5551, -0.3253] is reasonably narrow and entirely negative, and the p-value (1.2×10⁻¹⁰) confirms this correlation is highly statistically significant and not due to chance. However, statistical significance ≠ practical strength—with n=188, even modest correlations become highly significant. Critically, the Granger causality tests show no predictive direction in either direction (Bitcoin→CIVPART: p=0.36; CIVPART→Bitcoin: p=0.85). This strongly suggests the correlation is not causal in a temporal sense—neither variable helps forecast the other's future values, implying the relationship is likely driven by a shared external trend (e.g., both being correlated with time/calendar period) rather than genuine interaction.
3. Notable Patterns and Non-linear Features
The data shows a clear non-linear signature: at low Bitcoin prices (<$100), CIVPART values are elevated and highly variable (63.3–64.6%), while at high prices ($50,000), CIVPART compresses into a narrower, lower band (61.6–62.7%). This resembles a logarithmic decay rather than a straight line—consistent with the note that Spearman ρ likely exceeds Pearson r. The extreme X-axis skew (prices spanning 6 orders of magnitude) means a log-transform of X would likely produce a more linear and interpretable fit. There are no obvious outlier clusters violating the general pattern; rather, the "outliers" are simply the early low-price Bitcoin era data points sitting at higher CIVPART values.
4. Confounding Factors and Caveats
This is almost certainly a spurious or confounded correlation driven by time. Bitcoin price has trended upward over 2010–2026, while CIVPART has followed its own secular trajectory (partly recovering post-2020 pandemic dip, with longer-term structural decline from demographic aging/retirement of Baby Boomers). Both series are essentially trending against a shared timeline, not against each other. Additional caveats: mixing a highly volatile, non-stationary financial asset price with a slow-moving macroeconomic labor indicator invites autocorrelation issues in both series, inflating apparent correlation without genuine linkage. The mismatched sampling (188 monthly CIVPART points paired arbitrarily with Bitcoin prices) also risks alignment/lag artifacts.
5. Suggestions for Further Investigation
- Detrend both series (e.g., using year-over-year differences or residuals from time regression) before correlating, to test whether the relationship survives after removing shared temporal drift. - Log-transform Bitcoin price given its multi-order-of-magnitude range; this would likely improve linear fit and better represent proportional price changes. - Given the null Granger causality result, avoid treating this as a predictive/causal relationship in any forecasting model—treat it as coincidental co-trending. - Consider controlling for known CIVPART drivers (retirement demographics, COVID-19 shock, gender labor participation trends) to isolate whether any genuine Bitcoin-linked effect remains, if any is expected at all.
X dataset: Bitcoin Historical Price USD – All-Time Series (Habrador)
Y dataset: Civilian Labor Force Participation Rate (CIVPART)
Part of experiment: Bitcoin - Bitcoin Historical Price USD – All-Time Series (Habrador) vs Civilian Labor Force Participation Rate (CIVPART)