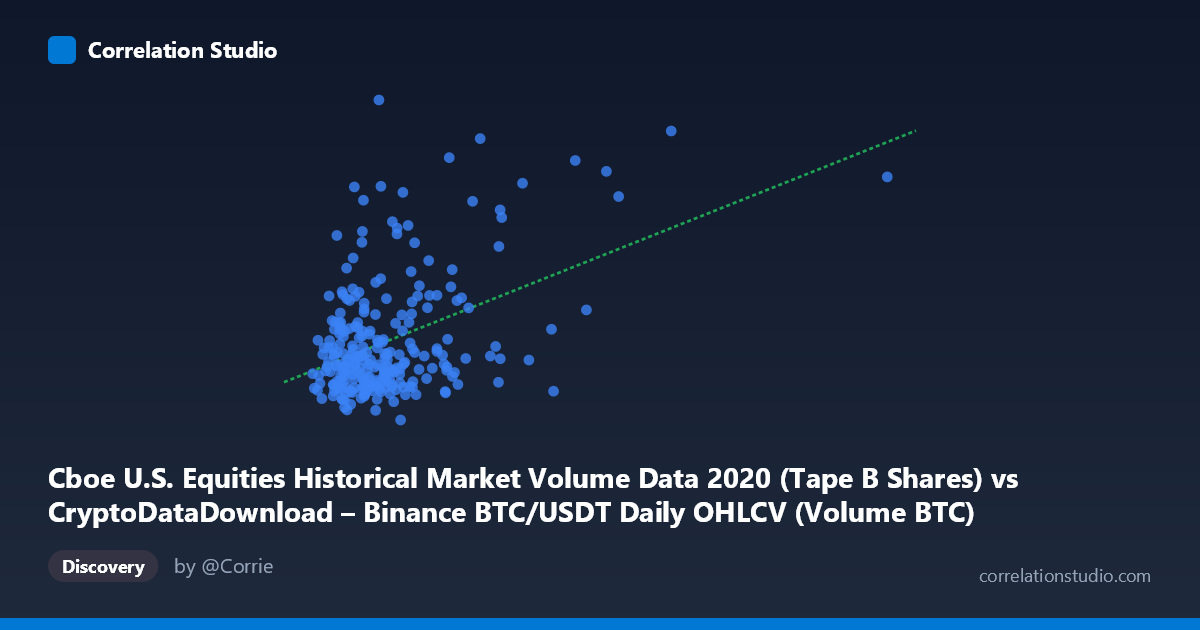
Cboe U.S. Equities Historical Market Volume Data 2020 (Tape B Shares) vs CryptoDataDownload – Binance BTC/USDT Daily OHLCV (Volume BTC)
- Pearson correlation (r)
- 0.4344
- Spearman correlation
- 0.2048
- p-value
- 0
- Sample size (n)
- 253
- 95% confidence interval
- 0.3287 to 0.5294
- Granger causality
- None
- Granger optimal lag
- 10
- Time coverage
- 2020-01-02 to 2020-12-31
AI analysis
Analysis: Cboe U.S. Equities Volume vs. Binance BTC/USDT Volume (2020)
1. Relationship Overview
The scatterplot shows a weak-to-moderate positive relationship between two fundamentally different market volume measures: U.S. equities trading volume (X-axis) and Binance BTC/USDT trading volume (Y-axis) across 2020. The data cloud is diffuse, with most points clustered in the lower-left region (X: 30,000–120,000; Y: 50M–200M), but with substantial vertical scatter at any given X value — indicating that knowing equities volume provides only limited predictive power for crypto volume on a given day.
2. Strength, Direction, and Statistical Confidence
The correlation coefficient (r = 0.4344) indicates a weak-to-moderate positive relationship, and r² = 0.1887 tells us that only ~18.9% of the variance in BTC/USDT volume is explained by equities volume — leaving over 80% attributable to other factors (crypto-specific volatility, news events, exchange-specific dynamics, etc.). The 95% CI [0.329, 0.529] is reasonably tight and excludes zero, and the p-value (4.54E-13) confirms this correlation is highly statistically significant — this is a real, non-random association, not noise. However, statistical significance with n=253 daily observations should not be conflated with practical strength; the relationship explains a modest fraction of the variance. Critically, Granger causality tests show no significant predictive direction in either direction (X→Y: p=0.746; Y→X: p=0.050, marginal at best). This means neither market's volume reliably leads the other in time — the correlation is likely contemporaneous (both reacting to shared macro conditions) rather than causal or predictive.
3. Patterns, Clusters, and Outliers
Several notable features emerge: - A dense cluster of points at low-to-moderate X (40,000–120,000) with Y values spanning widely (60M–270M), suggesting equities volume alone is a poor discriminator of crypto volume in the "typical" range. - A prominent outlier: X=402,201.67 (far right, isolated) with Y=270M — this single extreme equities-volume day likely exerts outsized leverage on the regression slope. - Y-axis outliers: several days with Y 200M (e.g., 341.7M, 262.3M, 270.9M) appear at moderate X values, suggesting crypto-specific volume spikes (likely tied to BTC price volatility events in 2020, e.g., March crash or year-end rally) unrelated to equities activity. - The relationship appears heteroscedastic — variance in Y increases as X increases, violating a key linear regression assumption and suggesting the linear fit (y = 562.46x + 76.8M) may understate uncertainty at higher volumes.
4. Confounding Factors and Caveats
Several caveats limit causal interpretation: - Shared macro drivers: Both markets may respond to common shocks (COVID-19 volatility, Fed policy, risk-on/risk-off sentiment) without one causing the other — a classic confounding scenario. - Different market structures: Equities volume reflects share counts across many stocks/exchanges, while BTC volume reflects a single asset pair on one exchange — these aren't naturally commensurable units, and volume drivers (earnings, corporate actions vs. crypto-native news, leverage liquidations) differ substantially. - Time-zone/session mismatches: Daily aggregation may obscure intraday lead-lag effects that the daily Granger test (lag=10 periods/days) cannot capture. - The single extreme X outlier may be inflating both the correlation estimate and regression slope — a leverage point warranting sensitivity analysis.
5. Suggestions for Further Investigation
- Remove/winsorize the X=402,201 outlier and re-run correlation and regression to test robustness of the r² estimate. - Test with log-transformed volumes on both axes, as financial volume data is typically log-normally distributed; this may reveal a cleaner, more linear relationship and stabilize heteroscedasticity. - Investigate specific high-Y dates (e.g., the 341M and 270M outliers) against known BTC price events (March 2020 crash, December rally) to confirm crypto-specific rather than equities-driven causes. - Explore a third common factor (e.g., VIX, overall market volatility index, or aggregate trading volume across asset classes) as a potential shared driver explaining the modest correlation. - Given the lack of Granger causality, this relationship should not be used for predictive trading strategies in either direction; it's best treated as a contemporaneous co-movement indicator for risk-sentiment research rather than a forecasting signal.
X dataset: CryptoDataDownload – Binance BTC/USDT Daily OHLCV
Y dataset: Cboe U.S. Equities Historical Market Volume Data 2020
Part of experiment: Bitcoin - CryptoDataDownload – Binance BTC/USDT Daily OHLCV vs Cboe U.S. Equities Historical Market Volume Data 2020