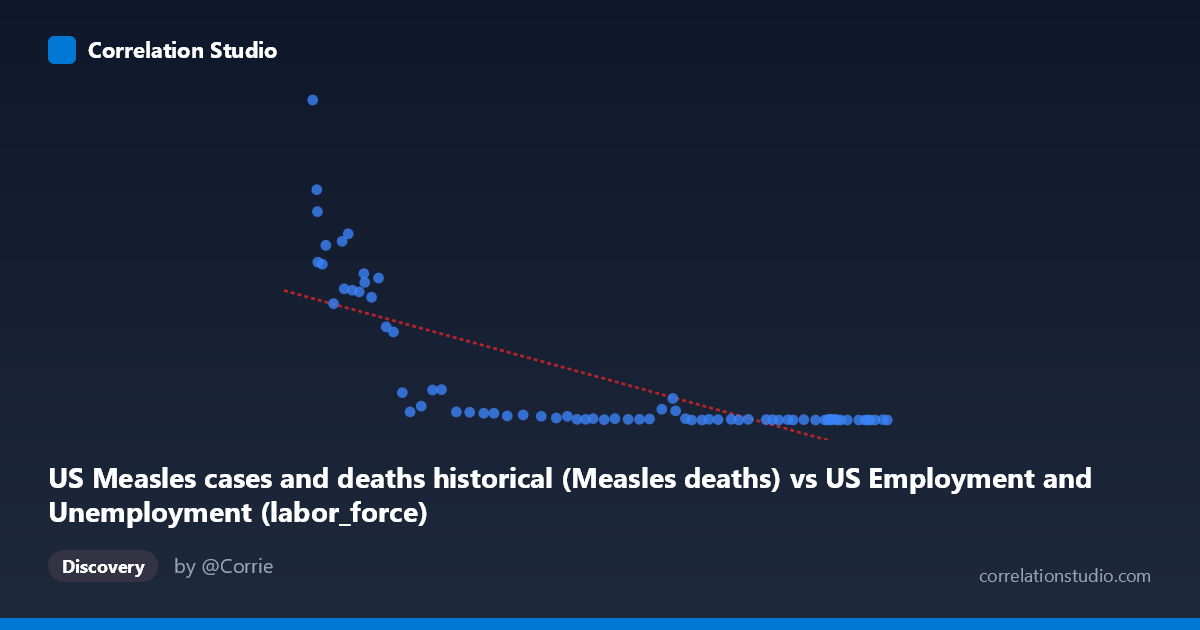
US Measles cases and deaths historical (Measles deaths) vs US Employment and Unemployment (labor_force)
- Pearson correlation (r)
- -0.7481
- Spearman correlation
- -0.9201
- p-value
- 0
- Sample size (n)
- 74
- 95% confidence interval
- -0.834 to -0.6267
- Granger causality
- None
- Granger optimal lag
- 10
- Time coverage
- 1949-01-01 to 2022-01-01
- Recomputed on refreshed data
- 2026-10-17 (r was -0.7481)
AI analysis
Scatterplot Analysis: US Measles Deaths vs. Labor Force Size
1. Overall Relationship Pattern
The scatterplot reveals a striking negative association between US Measles deaths (X-axis) and labor force size (Y-axis), spanning data from 1949 to 2022. The visual pattern is notably non-linear — the data clusters heavily near zero on both axes at one extreme (high labor force values in the hundreds, near-zero measles deaths), while a distinct arc of points sweeps upward toward the lower-left, where measles deaths were historically high and labor force figures were comparatively modest. This hyperbolic or exponential decay shape strongly suggests that a simple linear model, while capturing broad trends, understates the curvature inherent in the relationship.
2. Correlation Strength, Direction, and Causality
The Pearson correlation of r = -0.748 indicates a strong negative relationship, with the linear model explaining r² = 55.96% of the variance in labor force size — a substantial but incomplete share, leaving roughly 44% attributable to other factors. The 95% confidence interval of [-0.834, -0.627] is notably tight and entirely negative, confirming with high confidence that the direction of association is robustly inverse. The p-value of 1.865×10⁻¹⁴ is extraordinarily small, ruling out chance as an explanation for this pattern across the 74 paired observations. However, the Granger causality tests yield no significant predictive directionality in either direction (X→Y: F=1.16, p=0.34; Y→X: F=1.42, p=0.20), meaning that knowledge of past measles deaths does not improve forecasts of labor force size, and vice versa. This is a critical finding: statistical correlation does not translate into temporal predictability, which is a strong signal that the relationship is driven by a shared underlying process rather than any direct causal mechanism between the two variables.
3. Notable Patterns, Clusters, and Outliers
Several distinct features stand out. A dense cluster of points hugs the origin — dozens of observations with near-zero measles deaths and labor force values between 0 and ~100, representing the post-vaccination era (roughly 1965 onward) when measles was effectively eliminated in the US. In sharp contrast, a sparse but influential arc of high-leverage points occupies the lower-left region, including the most extreme outlier at approximately (61,286 deaths, 949 labor force units), which corresponds to earlier decades when measles mortality was substantial. Points like (62,138, 618), (62,017, 683), and (67,639, 552) reinforce this cluster. The Spearman ρ exceeding Pearson r confirms that ranks capture the relationship better than raw values, consistent with the visible non-linearity — a logarithmic or power-law transformation of X would likely produce a much tighter, more homoscedastic fit.
4. Confounding Factors and Interpretive Caveats
The most important caveat is that both variables are independently driven by historical time — this is almost certainly a case of spurious correlation mediated by secular trends. Measles deaths collapsed dramatically following the introduction of the measles vaccine in 1963 and the MMR vaccine program expansion in subsequent decades, a trajectory entirely independent of labor market dynamics. Simultaneously, the US labor force grew steadily across the same period due to population growth, Baby Boomer workforce entry, and rising female labor force participation. These are parallel but causally unrelated trends, both trending monotonically over time in opposite directions. Additionally, the datasets appear to be from mismatched sources — the X variable is labeled as originating from a US Employment dataset while the Y variable comes from the Measles dataset, suggesting potential metadata or labeling issues that warrant verification. The absence of Granger causality corroborates that no meaningful temporal predictive structure exists between them.
5. Actionable Insights and Further Investigation
Given the likely spurious nature of this correlation, the most productive next steps would include: (a) detrending both time series by removing the shared time trend (e.g., first-differencing or regressing each on year) before re-examining their residual correlation, which would likely collapse toward zero; (b) fitting a logarithmic or exponential decay regression (e.g., Y = a·e^(bX) or Y = a·ln(X) + b) to better characterize the non-linear relationship visible in the scatterplot, potentially improving explained variance beyond the current 56%; (c) verifying dataset column assignments, as the axis labels suggest a possible data merge error with variables assigned to opposing datasets; and (d) conducting a proper time-series analysis with a shared time covariate to isolate whether any relationship persists once temporal autocorrelation and the common historical trend are controlled. This case serves as a textbook illustration of why high correlation and low p-values alone are insufficient for inferring meaningful relationships without causal reasoning and confound control.
X dataset: US Employment and Unemployment
Y dataset: US Measles cases and deaths historical
Part of experiment: Yearly - US Employment and Unemployment vs US Measles cases and deaths historical