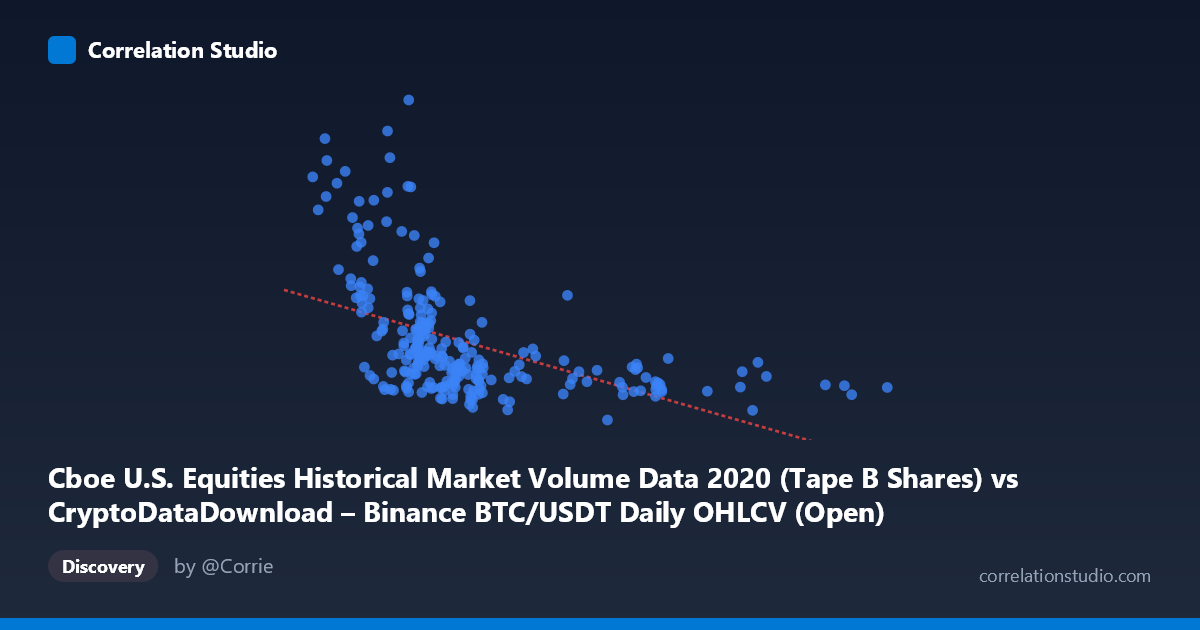
Cboe U.S. Equities Historical Market Volume Data 2020 (Tape B Shares) vs CryptoDataDownload – Binance BTC/USDT Daily OHLCV (Open)
- Pearson correlation (r)
- -0.4908
- Spearman correlation
- -0.6397
- p-value
- 0
- Sample size (n)
- 253
- 95% confidence interval
- -0.579 to -0.3911
- Granger causality
- None
- Granger optimal lag
- 10
- Time coverage
- 2020-01-02 to 2020-12-31
AI analysis
Analysis: BTC/USDT Volume vs. Cboe U.S. Equities Open Price Relationship
1. Overall Relationship Pattern
The scatterplot reveals a moderate negative relationship between the two variables: as one metric increases, the other tends to decrease, though with substantial scatter around any fitted trend line. The data is concentrated heavily in the lower-left region (X values under 12,000), with a sparse tail extending to higher X values (15,000–28,875) that show consistently lower, more compressed Y values. This creates a somewhat asymmetric, fan-shaped distribution rather than a clean linear band.
2. Strength, Direction, and Statistical Confidence
The Pearson correlation of r = -0.49 indicates a moderate negative linear association, with r² = 0.24 meaning only about 24% of the variance in Y is explained by X — leaving roughly 76% attributable to other factors or noise. The 95% CI [-0.579, -0.391] is reasonably tight and excludes zero, and the p-value of ~0 confirms the correlation is statistically significant and not a product of chance. However, statistical significance with n=253 does not imply strong predictive power — practically, X is a weak-to-moderate standalone predictor of Y. Critically, the Granger causality tests show no significant predictive direction in either direction (both p-values 0.05), meaning that despite the contemporaneous correlation, past values of one series do not meaningfully help forecast future values of the other. This strongly suggests the correlation is likely driven by a shared external factor or coincidental trend alignment over 2020 rather than a genuine causal or lead-lag relationship.
3. Notable Patterns and Outliers
Several high-leverage outliers are visible at low X values with extreme Y values (e.g., ~341.7M, 270.9M, 265.1M, 262.3M, 229.8M) — these points, clustered around X = 4,800–9,000, sit far above the main cloud and likely correspond to early-2020 volatility (possibly the March 2020 COVID crash, when equity trading volumes spiked dramatically). This creates heteroscedasticity: variance in Y is much higher at low X and compresses substantially at high X (X 15,000), where Y values stabilize in a narrow band (~66M–98M). The note that Spearman ρ exceeds Pearson r further supports the idea that a nonlinear (e.g., logarithmic or power-law) relationship fits better than a straight line — consistent with the visual "decay" pattern where Y drops sharply then levels off as X grows.
4. Confounding Factors and Caveats
Both variables are time series from 2020, a year marked by extraordinary market stress (COVID crash) and a subsequent bull run in both crypto and equities. Any correlation here is likely confounded by shared macroeconomic drivers — pandemic-driven volatility, retail trading surges, and monetary stimulus — rather than a direct mechanical link between Binance BTC/USDT volume and Cboe equity opening prices. Additionally, since both series are autocorrelated time series (not independent samples), the effective sample size for correlation testing is likely smaller than n=253 suggests, meaning the p-value may overstate confidence. The lack of Granger causality reinforces that this is probably a spurious or confounded correlation rather than a functional relationship.
5. Suggestions for Further Investigation
Given the nonlinear signal, refitting with a log-transform on X or a power/log model may improve fit and better characterize the diminishing-returns shape. Given the extreme early-2020 outliers, it would be worth re-running the analysis excluding the Feb–April COVID window to see if the correlation persists or collapses (a robustness check for regime-dependence). Since Granger causality is absent, treating this as a predictive trading signal is not advisable; instead, investigate a common third variable (e.g., VIX, overall market volatility index, or aggregate risk sentiment) that may drive both series simultaneously. Finally, given the time-series nature, differencing the data (or working with returns rather than levels) before correlating would help rule out spurious correlation from shared trends.
X dataset: CryptoDataDownload – Binance BTC/USDT Daily OHLCV
Y dataset: Cboe U.S. Equities Historical Market Volume Data 2020
Part of experiment: Bitcoin - CryptoDataDownload – Binance BTC/USDT Daily OHLCV vs Cboe U.S. Equities Historical Market Volume Data 2020