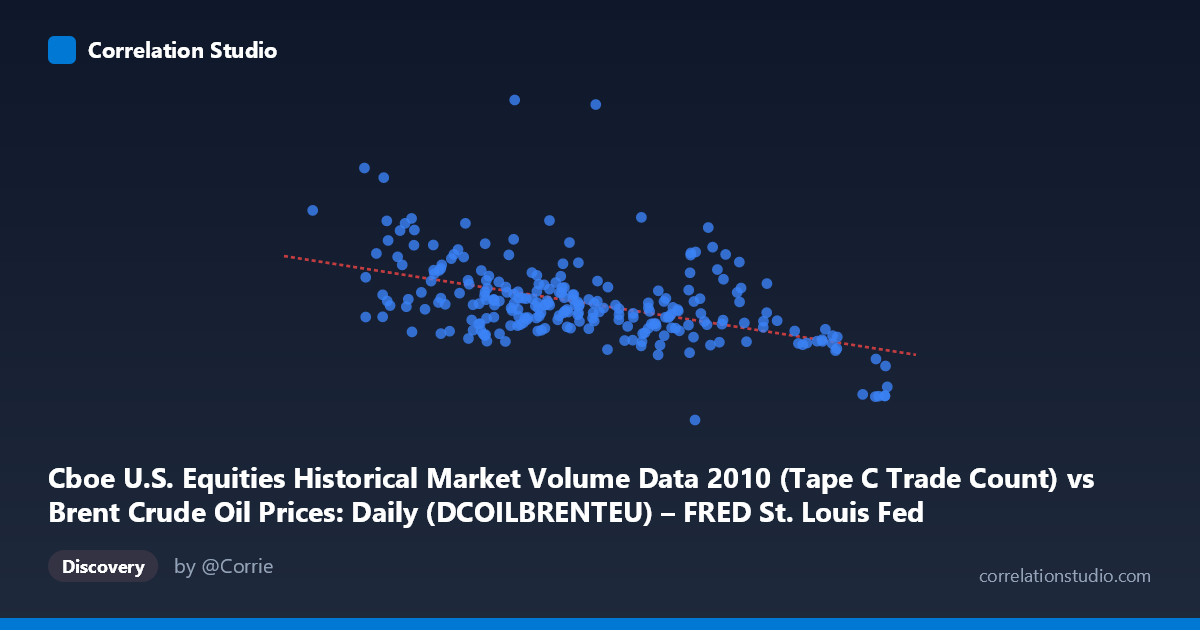
Cboe U.S. Equities Historical Market Volume Data 2010 (Tape C Trade Count) vs Brent Crude Oil Prices: Daily (DCOILBRENTEU) – FRED St. Louis Fed (DCOILBRENTEU)
- Pearson correlation (r)
- -0.4887
- Spearman correlation
- -0.4632
- p-value
- 0
- Sample size (n)
- 252
- 95% confidence interval
- -0.5774 to -0.3886
- Granger causality
- None
- Granger optimal lag
- 10
AI analysis
Analysis: Brent Crude Oil Price vs. Cboe Tape C Trade Count (2010)
Relationship Overview The scatterplot reveals a moderate negative relationship between the daily Europe Brent crude oil spot price (X-axis, USD/barrel) and the Cboe Tape C equity trade count (Y-axis). The linear regression equation (y = -12,791.7x + 1,633,790) indicates that for each additional dollar per barrel in crude oil price, equity trade counts decline by approximately 12,792 trades. Visually, this manifests as a downward-sloping cloud of points, with higher oil prices (roughly 85–94 USD/barrel) clustering toward lower trade volumes, while lower oil prices (67–75 USD/barrel) show a broader, more elevated range of trade activity. The relationship is directionally consistent but far from deterministic, as evidenced by substantial vertical scatter throughout the range.
Correlation Strength and Statistical Significance The Pearson correlation of r = -0.4887 reflects a moderate negative association. Critically, the R² of 0.2388 means only ~23.9% of the variance in trade counts is explained by oil price, leaving over 76% attributable to other factors. The 95% confidence interval of [-0.5774, -0.3886] is entirely negative and reasonably tight, confirming the directional finding is robust, and the p-value of 2.22E-16 makes statistical significance unambiguous given the large population (N = 3,302). However, statistical significance should not be conflated with practical magnitude — the explained variance is modest. Crucially, Granger causality tests find no significant predictive direction in either direction (X→Y: F = 1.006, p = 0.439; Y→X: F = 1.060, p = 0.395), meaning that even though a contemporaneous correlation exists, neither variable reliably predicts the other's future values at the optimal 10-period lag. This substantially weakens any causal inference.
Notable Patterns, Clusters, and Outliers Several features stand out in the data. The bulk of observations cluster in the 75–85 USD/barrel range with trade counts between roughly 400,000–800,000, forming a dense central mass. At the lower oil price extreme (67–73 USD/barrel), trade counts are notably elevated and more dispersed, with multiple points exceeding 800,000–1,000,000 trades — suggesting heightened market activity during lower-price periods. At least two prominent outliers are visible: the point near (76.48, 1,379,287) represents an extraordinarily high trade count relative to its oil price level, and the cluster around (93–94 USD/barrel) shows consistently depressed trade counts (~298,000–377,000). These extreme observations may be disproportionately influencing the regression slope and correlation coefficient. The relationship also shows heteroscedasticity — variance in trade counts is considerably wider at lower oil prices, narrowing as oil prices rise, suggesting the linear model may not fully capture the underlying structure.
Confounding Factors and Caveats Several important caveats limit interpretation. First, the axis labels appear swapped relative to the dataset descriptions — the X-axis is labeled as Brent crude price while the dataset association suggests trade count occupies that column, introducing potential confusion in directional interpretation. Second, 2010 was a period of post-financial-crisis recovery, characterized by unusual volatility in both equity markets and commodity prices that may not generalize to other periods. Third, both variables are driven by macro-level risk sentiment — broad risk-on/risk-off dynamics, economic data releases, and geopolitical events could independently move both oil prices and equity trading volumes, creating a spurious correlation without a direct causal mechanism. Fourth, the absence of Granger causality at a 10-period lag does not rule out relationships at other lags or frequencies. Finally, seasonal and day-of-week effects in equity trading volumes are well-documented and are not controlled for here.
Actionable Insights and Further Investigation Given the moderate but unexplained majority of variance, several investigative directions are warranted. Researchers should control for VIX (volatility index) and broad market return, as both likely co-move with oil prices and trade volumes independently. A non-linear or piecewise regression might better capture the apparent threshold effects visible at the price extremes (~85+ USD/barrel). Investigating the specific dates of outlier observations — particularly the single point near 1.38 million trades — could reveal event-driven anomalies (earnings seasons, OPEC announcements, macro shocks) that distort the overall pattern. A rolling-window correlation analysis across the year would reveal whether the relationship strengthens or weakens across different market regimes. Finally, extending the analysis to multiple years would test whether this 2010-specific finding reflects a durable relationship or a coincidental pattern unique to that recovery period.
X dataset: Brent Crude Oil Prices: Daily (DCOILBRENTEU) – FRED St. Louis Fed
Y dataset: Cboe U.S. Equities Historical Market Volume Data 2010
Part of experiment: Daily - Brent Crude Oil Prices: Daily (DCOILBRENTEU) – FRED St. Louis Fed vs Cboe U.S. Equities Historical Market Volume Data 2010