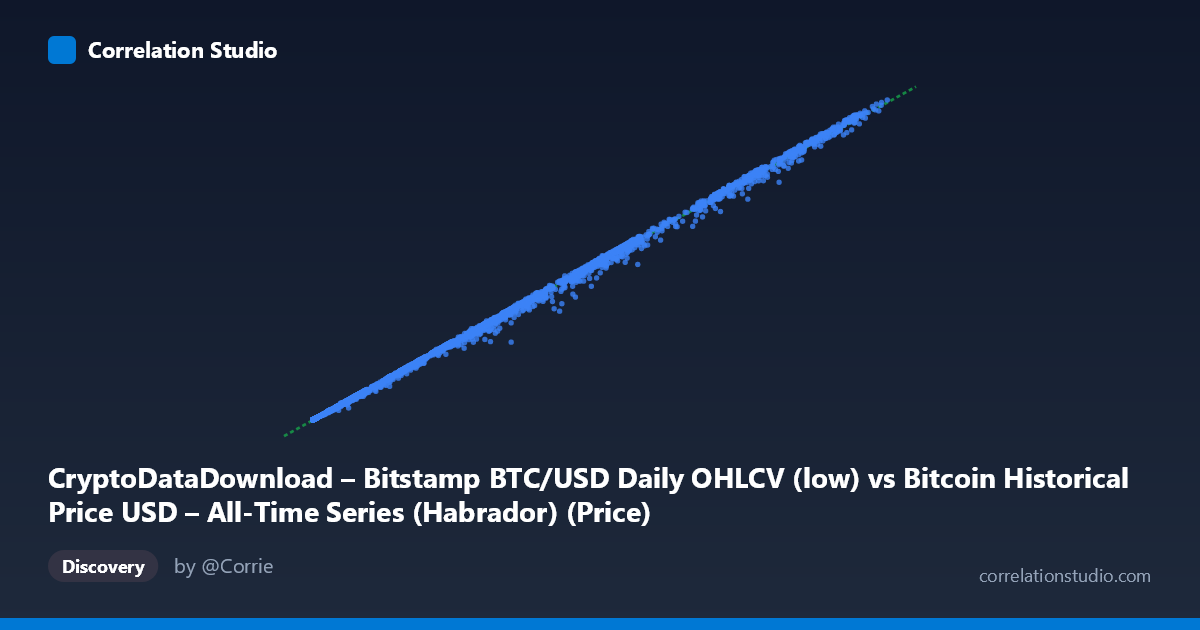
CryptoDataDownload – Bitstamp BTC/USD Daily OHLCV (low) vs Bitcoin Historical Price USD – All-Time Series (Habrador) (Price)
- Pearson correlation (r)
- 0.9996
- Spearman correlation
- 0.9997
- p-value
- 0
- Sample size (n)
- 4170
- 95% confidence interval
- 0.9996 to 0.9996
- Granger causality
- None
- Granger optimal lag
- 10
AI analysis
Analysis: BTC/USD Price Series Cross-Comparison (CryptoDataDownload vs. Habrador)
1. What the Visualization Reveals
This scatterplot compares two ostensibly independent sources of Bitcoin price history — a Habrador-compiled all-time BTC/USD series (X-axis, low price) and Bitstamp's daily OHLCV feed (Y-axis, price). The points fall almost perfectly along a straight line with slope ≈0.98 and intercept ≈-114, spanning nearly three orders of magnitude (from ~$150 to ~$125,000). This is not a "relationship between two variables" in the traditional sense of two distinct phenomena — it's two measurements of the same underlying asset price at the same points in time, just sourced/aggregated slightly differently (e.g., low vs. composite price, or different exchange snapshots).
2. Strength, Direction, and Statistical Meaning
The correlation (r = 0.9996, r² = 0.9992) indicates that 99.92% of the variance in one series is explained by the other — an almost deterministic linear relationship. The 95% CI [0.9996, 0.9996] is essentially a point estimate given the large n (4,170), and the p-value of ~0 confirms this is not a chance artifact. However, the Granger causality results are telling: neither direction (X→Y or Y→X) shows significant predictive causality (p = 0.98 and 0.97 at 10 lags). This makes sense — these aren't two variables where one drives the other over time; they're synchronized, contemporaneous measurements of the same market. Granger causality is the wrong lens here, and its null result actually reinforces that this is a measurement-identity relationship, not a lead-lag economic one.
3. Notable Patterns and Deviations
The fit is tight, but a few points show meaningful divergence — e.g., (68508.84, 65100.00), (31659.54, 28600.00), and (9224.39, 8170.71) deviate by several percent, more than the typical residual. These likely correspond to periods of high volatility or flash-crash/wick events where "low" price (Habrador) diverges more from a closing/representative price (Bitstamp), or where data-source timestamp misalignment (UTC vs. NY EST) causes a daily bar to capture different price action. The heteroscedastic spread (larger absolute deviations at higher price levels) is consistent with proportional/percentage-based noise rather than fixed-dollar noise, typical of financial price data across exchanges.
4. Confounding Factors and Caveats
The near-identity relationship is a strong hint that this correlation is structurally guaranteed rather than an empirical discovery — both series track the same asset. Key caveats: (a) different exchanges (Bitstamp vs. whatever Habrador aggregates) can show small price discrepancies from arbitrage lag, liquidity differences, or fee structures; (b) "low" vs. "price"/close are different intraday statistics, guaranteeing some systematic offset (the slope <1 and negative intercept may partly reflect low ≤ close); (c) timezone/date-boundary differences (NY EST daily bars vs. UTC) can shift which trades fall into which day, especially around volatile days; (d) applying Pearson r/Granger causality to two non-stationary, trending price series (rather than returns) inflates correlation trivially — nearly any two monotonically-trending series over a decade will show r 0.99.
5. Actionable Insights
Given the redundancy, the analysis should shift from "is there a relationship" to reconciliation/data-quality: (1) compute the residuals (Y − predicted Y) and flag the largest outliers for manual date-level review — these likely mark data errors, exchange-specific volatility, or timestamp misalignment worth correcting; (2) re-run the correlation on daily returns (percentage changes) rather than raw price levels — this is the statistically appropriate test and will reveal whether the two sources agree on volatility/movement, not just level; (3) since Granger causality is not meaningful for identical/near-identical series, drop that framing and instead use this pair as a data validation/cross-check for merging the two datasets into a single canonical BTC price series, using the regression (y = 0.98x − 114) as an adjustment formula if one series must be calibrated to the other.
X dataset: Bitcoin Historical Price USD – All-Time Series (Habrador)
Y dataset: CryptoDataDownload – Bitstamp BTC/USD Daily OHLCV
Part of experiment: Bitcoin - Bitcoin Historical Price USD – All-Time Series (Habrador) vs CryptoDataDownload – Bitstamp BTC/USD Daily OHLCV