S&P 500 Daily Time Series since 1927 (GitHub fja05680) (Date) (Low) vs Cboe U.S. Equities Historical Market Volume Data 2010 (Tape B Shares)
- Pearson correlation (r)
- -0.4204
- Spearman correlation
- -0.4397
- p-value
- 0
- Sample size (n)
- 252
- 95% confidence interval
- -0.5171 to -0.3131
- Granger causality
- Y → X
- Granger optimal lag
- 1
AI analysis
Analysis: S&P 500 Low Price vs. Cboe Tape B Share Volume (2010)
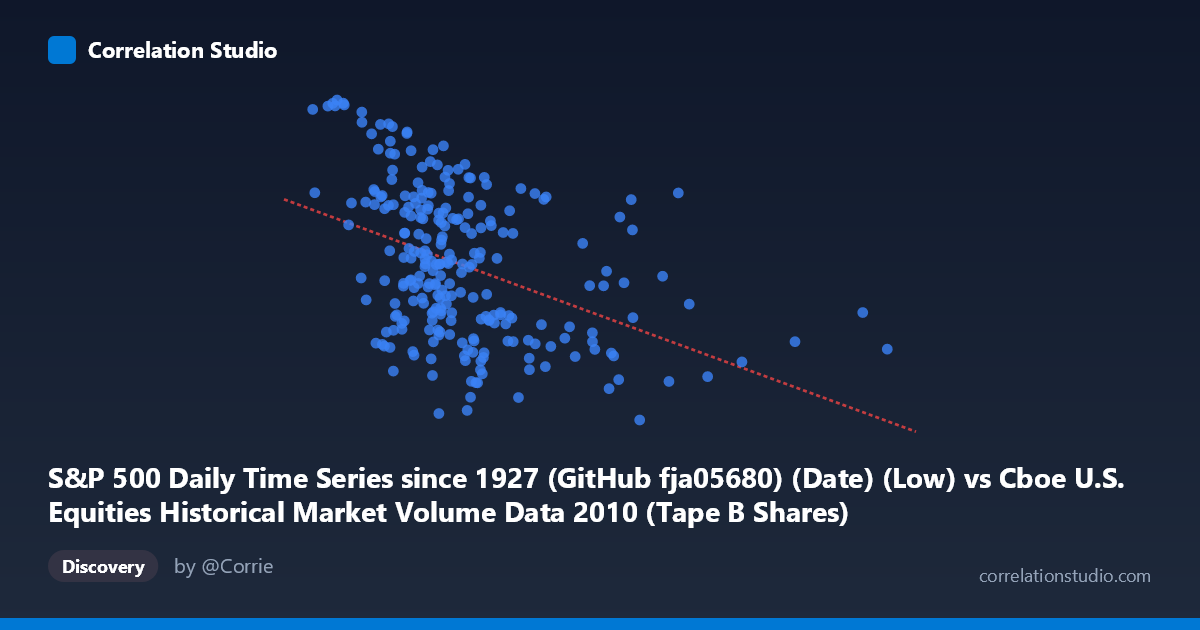
Relationship Overview The scatterplot reveals a moderate negative relationship between the S&P 500 daily low price (X-axis) and Cboe Tape B share volume (Y-axis) across 252 trading days in 2010. As the S&P 500 daily low increases — reflecting higher index valuations — Tape B share volume tends to decrease. This inverse pattern is visually consistent with the fitted regression line (y = -5.62×10⁻⁷x + 1194.75), which descends from roughly 1,250 shares at lower price levels toward approximately 1,050 shares at the highest observed price levels. The relationship, while discernible, is far from deterministic, with considerable vertical scatter throughout the range.
Correlation Strength and Statistical Significance The Pearson correlation of r = -0.4204 indicates a moderate negative association, but the explanatory power is modest: r² = 0.177, meaning only 17.7% of the variance in Tape B volume is attributable to the S&P 500 low price. The remaining ~82% is driven by other factors entirely. The 95% confidence interval of [-0.517, -0.313] is entirely negative and does not cross zero, and the p-value of 3.27×10⁻¹² confirms the relationship is highly statistically significant and very unlikely to be a chance artifact given the population of N = 3,302 and sample of n = 252. Critically, the Granger causality results suggest a unidirectional temporal relationship: Y Granger-causes X (F = 4.51, p = 0.035, lag = 1 period), meaning Tape B volume has statistically meaningful predictive power for the next day's S&P 500 low price, but not vice versa (X→Y: F = 3.42, p = 0.066, which falls just short of conventional significance). This is a noteworthy finding — it implies volume dynamics may lead price behavior with a one-day lag.
Patterns, Clusters, and Outliers Several structural features stand out in the data. There is a visible dense cluster of observations in the X range of roughly 75M–150M and Y range of 1,050–1,200, representing the bulk of typical trading days. At lower S&P 500 low values (roughly below 70M on the X-axis), Tape B volume tends to be elevated, consistent with the early-2010 period when the index was recovering from post-crisis lows and trading activity was elevated. A handful of notable outliers are apparent: one point near (316M, ~1,094) stands well to the right of the main cloud, suggesting an anomalous session with unusually high market activity yet a mid-range price level. Similarly, points near Y = 1,254–1,258 at low X values represent high-volume days during lower price periods. The scatter is notably heteroscedastic — variance in Tape B volume appears wider at moderate X values and slightly compressed at the extremes.
Confounding Factors and Caveats Several important caveats apply. First, the axis labels appear to be swapped or counterintuitive in dataset attribution — the X variable is labeled as "Low" from the S&P 500 price series but drawn from a Cboe volume dataset, and vice versa for Y; this warrants careful data provenance review before drawing firm conclusions. Second, the negative correlation likely reflects a secular trend confound: in early 2010, S&P 500 prices were lower and market uncertainty was higher, driving elevated trading volumes; as the year progressed and the index climbed, volumes normalized downward — a classic mean-reversion or risk-regime pattern rather than a direct causal price-volume mechanism. Third, Tape B specifically covers NYSE American (AMEX) and regional exchange-listed securities, a subset of total market volume, which may behave differently from the broad market. Finally, Granger causality establishes temporal precedence, not true causality — omitted variables such as macroeconomic news, VIX levels, or institutional flows could drive both series simultaneously.
Actionable Insights and Further Investigation The finding that Tape B volume Granger-causes S&P 500 low prices suggests a potentially exploitable leading indicator relationship worth deeper investigation. Practitioners could test whether elevated Tape B volume on day t systematically predicts lower S&P 500 lows on day t+1, potentially informing short-term risk management or hedging strategies. Analysts should detrend both series to remove the secular 2010 price recovery trend before re-estimating correlations, as this would isolate the genuine intraday or short-term relationship from the broader bull-market backdrop. Expanding the analysis to multiple years would test whether the r = -0.42 finding holds across different market regimes (e.g., bear markets, low-volatility periods). Additionally, incorporating VIX or realized volatility as a control variable could clarify whether the price-volume relationship is primarily mediated through fear/uncertainty rather than being a direct structural linkage.
X dataset: Cboe U.S. Equities Historical Market Volume Data 2010
Y dataset: S&P 500 Daily Time Series since 1927 (GitHub fja05680) (Date)
Part of experiment: Daily - Cboe U.S. Equities Historical Market Volume Data 2010 vs S&P 500 Daily Time Series since 1927 (GitHub fja05680) (Date)