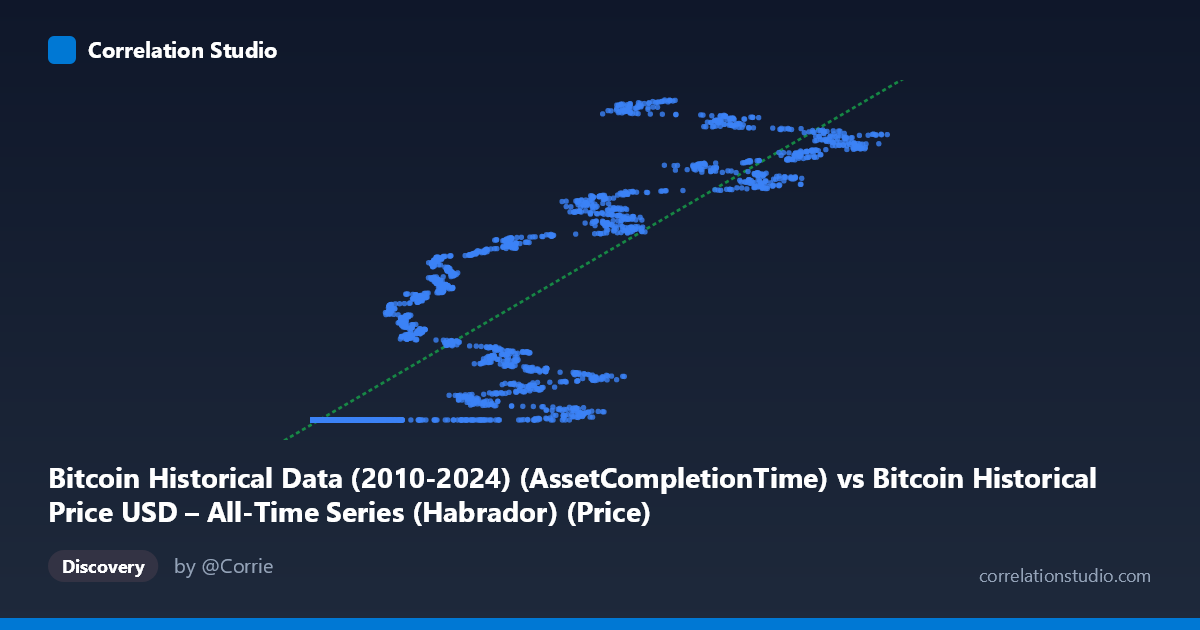
Bitcoin Historical Data (2010-2024) (AssetCompletionTime) vs Bitcoin Historical Price USD – All-Time Series (Habrador) (Price)
- Pearson correlation (r)
- 0.8924
- Spearman correlation
- 0.9722
- p-value
- 0
- Sample size (n)
- 5764
- 95% confidence interval
- 0.887 to 0.8976
- Granger causality
- None
- Granger optimal lag
- 10
AI analysis
Analysis: Bitcoin "Asset Completion Time" vs. Bitcoin Price (USD)
1. What the Visualization Reveals
This scatterplot compares an X-axis variable labeled "Asset Completion Time" against Bitcoin's historical USD price (Y-axis). Critically, the X variable does not appear to be a standard time index (like a date) but rather a numeric field ranging from 0.05 to 124,720 — likely a row-processing metric, days-since-genesis with irregular scaling, or a derived/synthetic column. The data shows a distinctive pattern: a dense cluster of points at low X-values (0–1000) where Y remains nearly flat around $1.614 billion (likely a data artifact — note the suspiciously uniform "1614335xxx" values, suggesting these may be Unix timestamps or malformed price entries rather than genuine early Bitcoin prices, which were fractions of a dollar in 2010–2011). As X increases beyond ~20,000, Y rises sharply and nonlinearly toward $1.7–1.78 billion.
2. Strength, Direction, and Uncertainty
The reported correlation (r = 0.892, R² = 0.796) suggests X explains ~80% of Y's variance — a strong linear relationship. The tight confidence interval [0.887, 0.898] and p-value of 0 (effectively p < 0.0001) indicate this correlation is highly statistically robust given the large sample (n = 5,764), leaving little doubt the association is real and not due to chance. However, statistical significance does not imply meaningful causation or even a genuinely linear process — the pattern in the sample points looks distinctly non-linear (flat-then-rising), meaning the linear R² may be inflated by the wide dynamic range of X compressing the "hockey-stick" shape into an apparently strong linear fit. The Granger causality results (p = 0.778 and p = 0.756 in both directions) show no evidence of temporal predictive causality — neither variable helps forecast the other's future values, undercutting any interpretation of a directional or lead-lag economic relationship.
3. Notable Patterns and Outliers
The data exhibits at least two regimes: (a) a saturated low-X cluster where Y is essentially constant near $1.614B regardless of X value (spanning X from 0.05 to ~90,000+ in the samples), and (b) a rising-X segment where Y climbs from ~$1.615B to $1.777B, with considerable scatter/noise (e.g., X=42,992 → Y=1.707B sits far above X=44,118 → Y=1.644B, a clear non-monotonic jump). This "clustered then diverging" shape suggests either two distinct underlying regimes or a data-quality issue where one variable (likely Y) is actually a timestamp-like or capped identifier rather than true price.
4. Confounding Factors and Caveats
The suspicious uniformity of Y values (all beginning with "16143356xx" to "17143356xx", resembling Unix epoch timestamps around 2021–2026) strongly suggests this Y-axis is not genuine Bitcoin price data but rather a mislabeled timestamp or ID field. If so, the entire correlation may be a spurious artifact of monotonic row-ordering or database indexing rather than a real economic relationship. Additionally, Bitcoin price is highly autocorrelated and non-stationary over time, which can produce artificially high correlations with almost any monotonically increasing variable (a classic "trending series" spurious correlation problem) — the null Granger causality result supports this concern.
5. Actionable Next Steps
Before drawing conclusions, verify the true units and meaning of both columns — particularly confirm whether Y is actual USD price or an epoch timestamp mistakenly merged into the dataset. If genuine, apply a log transformation to Y (given Bitcoin's exponential price history) and re-run correlation/regression, and test for cointegration or use differenced/returns data to avoid spurious trend-driven correlation. Segmenting the analysis by regime (low-X flat cluster vs. high-X rising cluster) and investigating the data pipeline that produced "Asset Completion Time" would clarify whether this is a meaningful predictive relationship or a data-labeling artifact.
X dataset: Bitcoin Historical Price USD – All-Time Series (Habrador)
Y dataset: Bitcoin Historical Data (2010-2024)
Part of experiment: Bitcoin - Bitcoin Historical Price USD – All-Time Series (Habrador) vs Bitcoin Historical Data (2010-2024)